FIGURE 1.

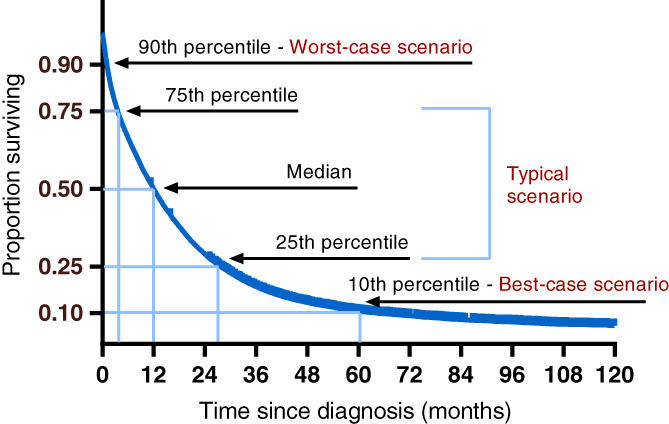
Survival curve percentiles and their corresponding scenarios, adapted from Kiely [14], for illustrative purposes only [Color figure can be viewed at wileyonlinelibrary.com]

Survival curve percentiles and their corresponding scenarios, adapted from Kiely [14], for illustrative purposes only [Color figure can be viewed at wileyonlinelibrary.com]