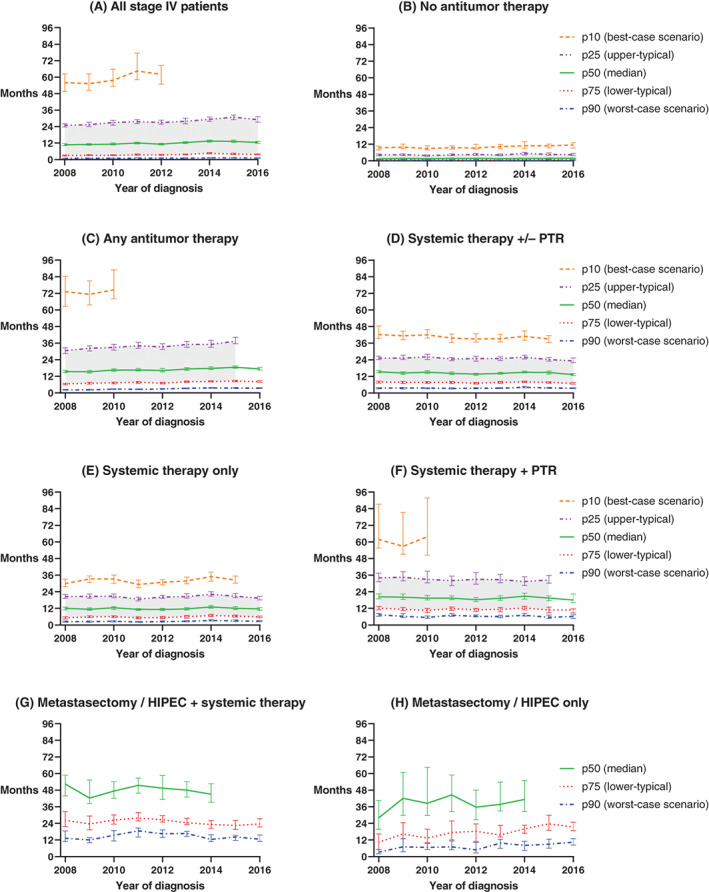
FIGURE 2.

Change in OS of stage IV CRC patients over time for different scenarios. The patterned lines represent five survival percentiles, and three scenarios for survival. For example, the p10 line represents the tenth percentile, or the time at which 10 percent of all patients were still alive (best‐case scenario). The p50 line represents the fiftieth percentile (the median), or the time at which 50 percent of patients were still alive. The grey shading represents the typical scenario, i.e. the 75th to 25th percentile (interquartile range), representative of survival times for the middle 50% of patients. Error bars are 95% CI. (A) All stage IV patients, (B) Patients who did not receive any antitumour therapy (only best supportive care), (C) Patients who received any form of local and/or systemic antitumour therapy, (D) Patients who received systemic antitumour therapy +/‐ primary tumour resection, without metastasectomy / HIPEC / non‐surgical local treatment of liver metastasis / radiotherapy of metastasis, (E) Patients who received systemic antitumour therapy only, (F) Patients who received systemic therapy and primary tumour resection, without metastasectomy / HIPEC / non‐surgical local treatment of liver metastasis / radiotherapy of metastasis, (G) Patients who received both metastasectomy and/or HIPEC plus systemic therapy, with or without primary tumour resection / non‐surgical local treatment of liver metastasis / radiotherapy of metastasis, (H) Patients who received metastasectomy and/or HIPEC only (i.e. without systemic therapy), with or without primary tumour resection / non‐surgical local treatment of liver metastasis / radiotherapy of metastasis. Treatment subgroups are based on the initial treatment received. For some treatment groups and incidence years, the highest percentiles cannot yet be displayed due to insufficient follow‐up time to calculate point estimates or complete the 95% CIs. For the same reason, the typical scenario cannot yet be displayed for groups (G) and (H) [Color figure can be viewed at wileyonlinelibrary.com]
