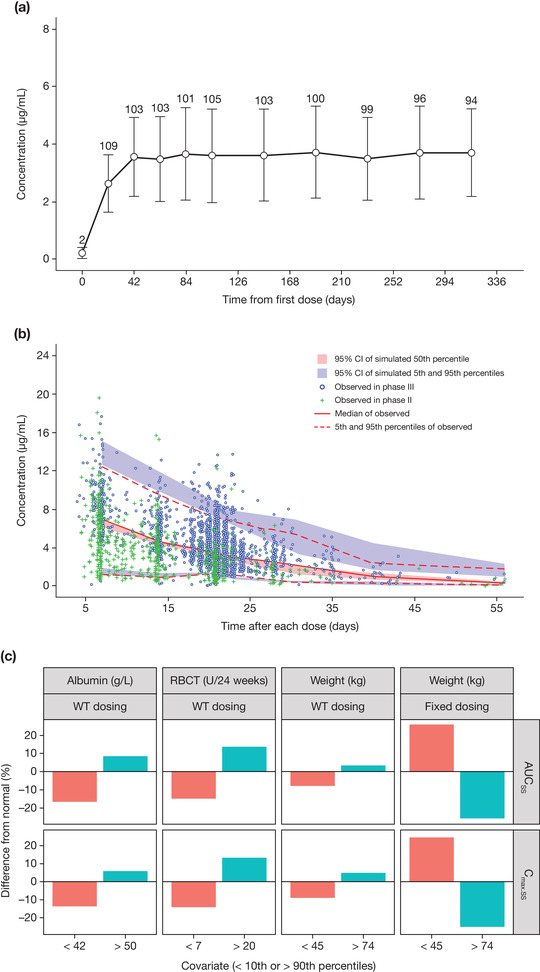
Figure 1.

Pharmacokinetic profiles of luspatercept in adult patients with β‐thalassemia. (A) Observed mean (standard deviation) trough serum concentration of luspatercept in the pivotal phase 3 study. (B) Visual predictive check for the final population pharmacokinetic model of luspatercept. (C) Clinical relevance of statistically significant covariates. In (A), only patients who had a dose of 1 mg/kg without any dose modification during the entire pharmacokinetic evaluation period are included, and the number above each error bar shows the number of patients at each point. In (C), the numbers on the x axis represent values < the 10th percentile and > the 90th percentile for the corresponding covariate. % Difference from normal, % difference in median exposure at the low or high covariate values relative to the normal covariate values; AUCss, area under the concentration‐time curve at steady state; CI, confidence interval; Cmax.ss, maximum concentration at steady state; RBCT, baseline red blood cell transfusion; WT, body weight.
