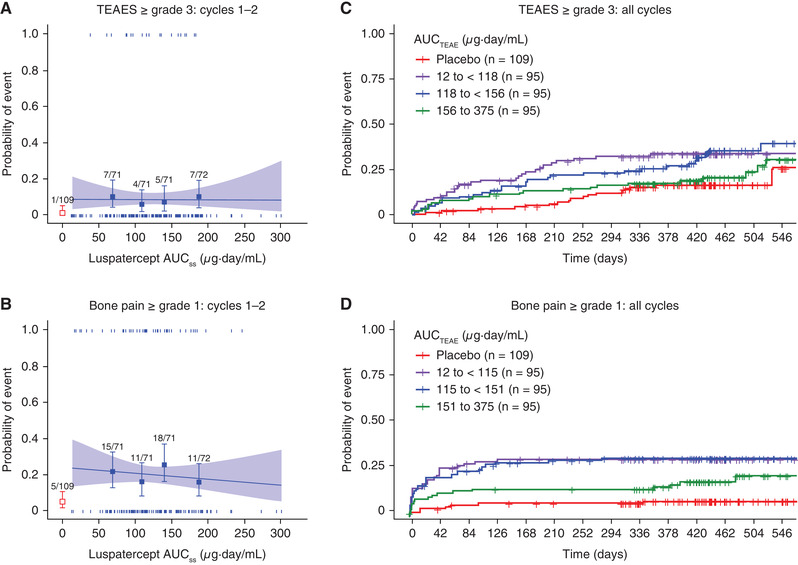
Figure 4.

Association of luspatercept exposure with TEAEs ≥ grade 3 or bone pain ≥ grade 1. (A, B) Logistic regression analyses of the relationship between luspatercept serum exposure and the probability of experiencing the event during the first 2 treatment cycles. (C, D) Kaplan‐Meier curves of the time to the first event stratified by the exposure group during the entire study (all available treatment cycles). In (A) and (B), observed proportions (squares) and 95%CIs (error bars) are presented along with the predicted logistic regression fits (slanting lines) and 95%CIs (shaded area). Red open square and error bar (bottom left) are data from placebo‐treated patients. Vertical ticks at individual values of AUCTEAE represent whether the patient achieved an event (at 1) or not (at 0). The numbers above the error bars show the number of patients with the event (numerator) and total number of patients (denominator) within each AUCTEAE quartile. AUCss, area under the concentration‐time curve at steady state for the starting dose; AUCTEAE, area under the concentration‐time curve at steady state during the dosing period when the event occurred; CI, confidence interval; TEAE, treatment‐emergent adverse event.
