
FIGURE 2.
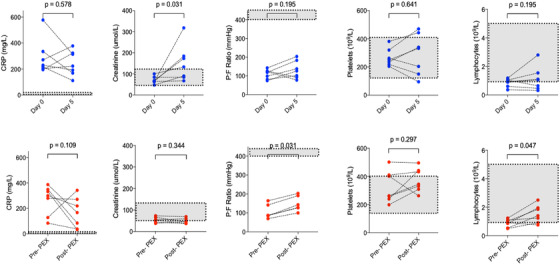
Comparison of clinical and biochemical data of control patients and patients before and following five courses of plasma exchange. Top panel in blue: control patients. Bottom panel in red: PEX patients. Gray areas highlight normal ranges. (n = 7) apart from PaO2:FiO2 ratio in PEX group (n = 6) and serum creatinine (n = 6)
Abbreviation: PEX, plasma exchange.