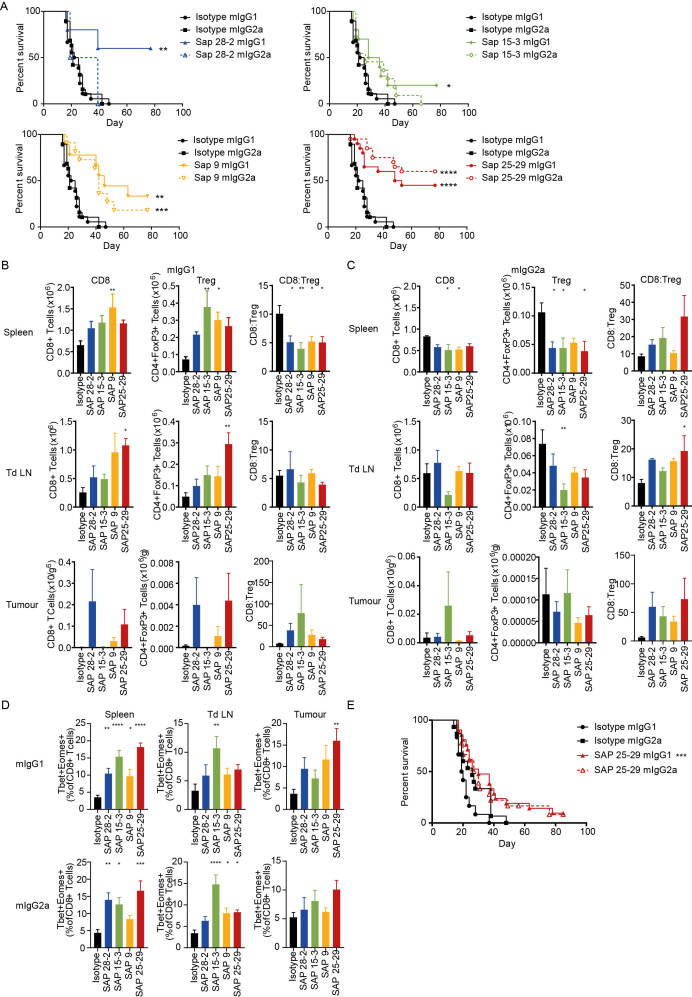
Figure 6.
Anti-hOX40 mAb are therapeutic as both mIgG1 and mIgG2a. (A) Survival curves for mice challenged with E.G7 lymphoma cells (0.5×10⁶) and treated with 3×100 μg mAb once tumors are between 5×5 mm and 10×10 mm. Data pooled from two independent experiments (n=5 SAP 28–2, n=10 SAP 15–3 and SAP 9, n=20 isotype controls and SAP 25–29). assessment of T-cell populations in spleen (top panels), tdLN (middle panels), and tumor (bottom panels) isolated 24 hours post second mAb dose either as a mIgG1 (B) or mIgG2a (C). n=5 except for SAP 28–2 mIgG2a n=4 for all organs and SAP15–3 and SAP 25–29 mIgG1 in tumor n=3 due to tumor regression, representative of two independent experiments. (D) Analysis of T-box transcription factors and eomesodermin expression in CD8+ T cells isolated from spleen (left panels), tdLN (middle panels) and tumor (right panels) from mice treated with either mIgG1 (top row) or mIgG2a (bottom row). Data pooled from two independent experiments (n=8 SAP 28–2, all other groups n=9). (E) Survival graphs for mice challenged with MCA-205 cells (0.5×10⁶) and treated with 3×100 μg mAb once tumors were 5×5 mm. Data pooled from three independent experiments (n=12 isotype mIgG1, n=15 isotype mIgG2a, n=18 SAP 25–29 mIgG2a and n=21 SAP 25–29 mIgG2a). Mean±SEM ****p<0.0001, ***p<0.001, **p<0.01, *p<0.05, Log-rank (Mantel-Cox) for survival graphs (A and E) and Dunnett’s multiple comparison test (B to D). mAb, monoclonal antibody; tdLN, tumor-draining lymph node.

