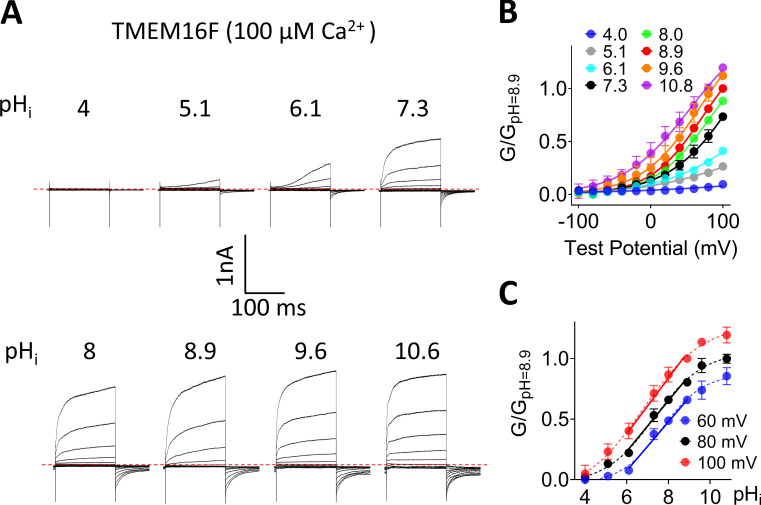
Figure 1.
pHi regulates TMEM16F ion channel activity. (A) Representative TMEM16F currents recorded from inside-out patches perfused with intracellular solutions containing 100 µM Ca2+ at different pHi values. Currents were evoked by voltage steps from −100 to +100 mV with 20 mV increments, and the holding potential was −60 mV. All traces shown were from the same patch. (B) Mean G-V relations of the TMEM16F channels under different pHi values at 100 µM Ca2+. Relative conductance was determined by measuring the amplitude of tail currents 400 µs after repolarization to a fixed membrane potential (−60 mV). The smooth curves represent Boltzmann fits G/Gmax = 1/{1 + exp[−ze(V − V1/2]/kT}. Gmax is tail current amplitude in response to depolarization to +100 mV in 100 µM Ca2+ at pHi 8.9. Error bar represents SEM (n = 7). (C) G-pHi relationship for TMEM16F channels. Data were normalized to pHi 8.9. Dashed line represents Boltzmann fit. G-pHi curves from 6.1 to 8.9 were fitted with linear regression shown as the solid lines, which aligned well with the Boltzmann fits (dashed line). Thus, the mean slopes from linear regression were used as a parameter for pHi sensitivity in later experiments (n = 7).

