Figure 2.
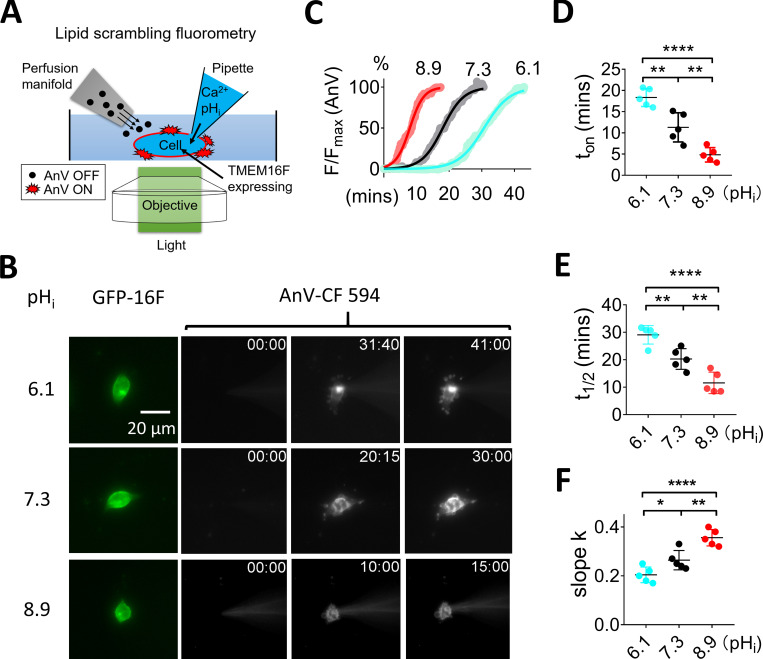
pHi regulates TMEM16F lipid scrambling activity. (A) Schematic design of the lipid scrambling fluorometry assay. CaPLSase activity is monitored by cell-surface accumulation of fluorescently tagged AnV, a PS binding protein that is continuously perfused through a perfusion manifold. AnV fluorescence remains dim in bulk solution and will strongly fluoresce after being recruited by cell surface PS, which is externalized by CaPLSases. We use whole-cell patch pipettes to deliver intracellular solutions into the cytosol to achieve precise control of pHi and Ca2+. Once breaking into whole-cell configuration, the pipette solution rapidly diffuses into the cell and activates CaPLSases. AnV fluorescence signal on the cell surface was continuously recorded with 5-s intervals. (B) Representative lipid scrambling fluorometry images of HEK293T cells stably expressed with TMEM16F-eGFP (left, green signal) at different pHi values. For the AnV-CF 594 signal on the right, the first column is fluorescence signal immediately after forming whole-cell configuration; the second column is the time when fluorescence intensity reached half maximum (t1/2), and the last column is the time when fluorescence signal reached roughly plateau. The time points (minutes followed by seconds) of each image after breaking into whole-cell configuration are shown on the top right corner. The pipette solution contained 100 µM Ca2+, and holding potential was −60 mV. See also Video 1. (C) The time course of AnV fluorescence signal at different pHi values as shown in B. The AnV signal was normalized to the maximum AnV fluorescence intensity at the end of each recording. The smooth curves represent fits to generalized logistic equation, F = Fmax/{1 + exp[−k(t − t1/2)]}. (D) Under 100 µM Ca2+, the onset times (ton), when AnV signal can be reliably detected, for pHi 6.1, 7.3, and 8.9 are 18.3 ± 1.3 (n = 5), 11.3 ± 1.4 (n = 5), and 4.5 ± 0.7 min (n = 5), respectively. (E) Under 100 µM Ca2+, t1/2 values for pHi 6.1, 7.3, and 8.9 are 29.07 ± 1.35, 20.28 ± 1.51, and 11.59 ± 1.56 min (n = 5), respectively. (F) Under 100 µM Ca2+, slopes for pHi 6.1, 7.3, and 8.9 are 0.19 ± 0.01, 0.26 ± 0.02, and 0.40 ± 0.02 (n = 5), respectively. Values represent mean ± SEM. *, P < 0.05; **, P < 0.01; ****, P < 0.0001, using one-way ANOVA followed by Tukey’s test.

