Figure 3.
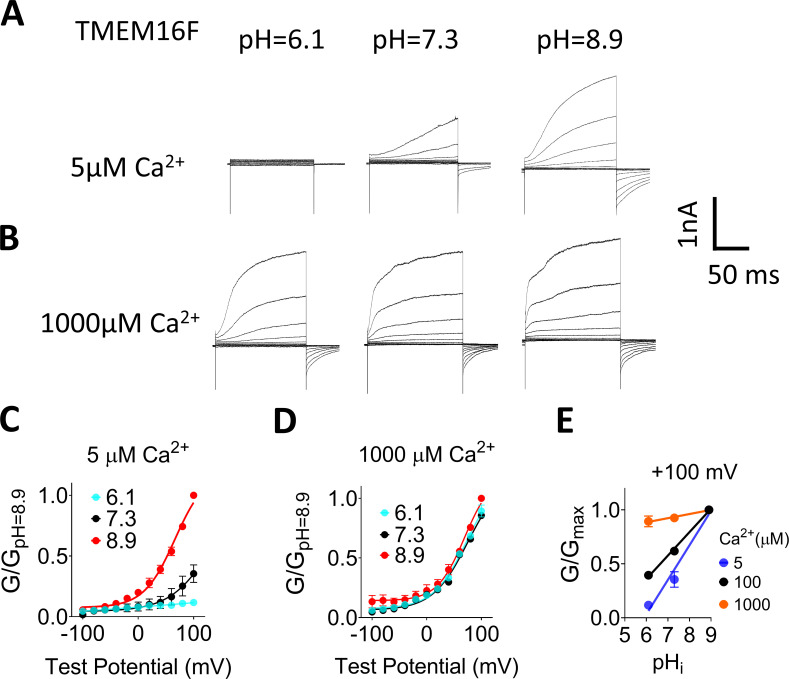
pHi regulation of TMEM16F channel activity is Ca2+ dependent. (A and B) Representative TMEM16F currents recorded from inside-out patches perfused with intracellular solutions containing 5 and 1,000 µM Ca2+, respectively. All traces shown in each panel were from the same patch. Currents were elicited by voltage steps from −100 to +100 mV with 20-mV increments. The holding potential was −60 mV. (C and D) Mean G-V relations of the TMEM16F currents from A and B, respectively. Relative conductance was determined by measuring the amplitude of tail currents 400 µs after repolarization to a fixed membrane potential (−60 mV). The smooth curves represent Boltzmann fits. Error bars represent SEM (n = 5). (E) pHi sensitivity of TMEM16F current at +100 mV was measured by the slope of the the G-pHi relationship. Mean conductance at different Ca2+ concentrations was normalized to the maximum conductance at pHi 8.9 and +100 mV. Averaged slopes from linear fit for 5 and 1,000 µM Ca2+ were 0.32 and 0.04, respectively. The G-pHi curve at 100 µM Ca2+ was replotted as black line for reference. Error bars represent SD (n = 5).

