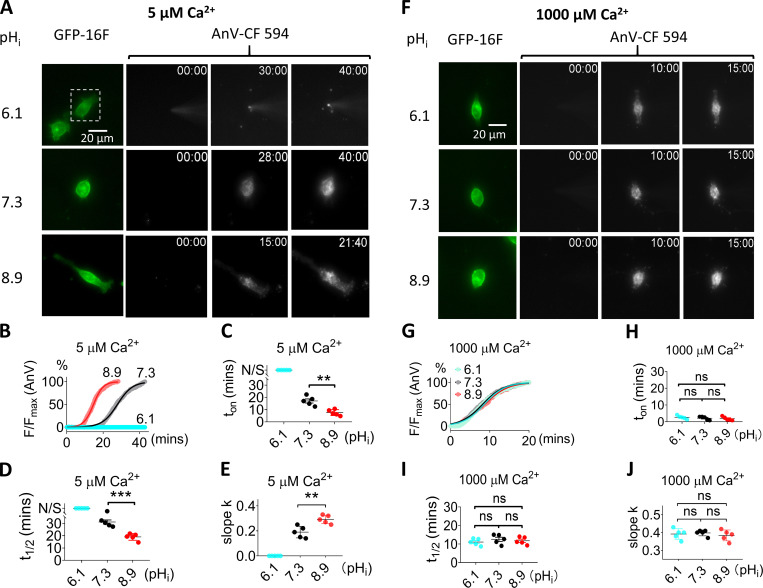
Figure 4.
pHi regulation of TMEM16F scrambling activity is Ca2+ dependent. (A) Representative images of TMEM16F-eGFP scrambling activity under 5 µM intracellular Ca2+ with different pHi values. The white dotted rectangles in the top row demarcate the patch-clamped TMEM16F-eGFP–expressing cells. For the AnV-CF 594 signals on the right, the first column is fluorescence signal immediately after forming whole-cell configuration; the second column is the time point (minutes followed by seconds, top right corner) when fluorescence intensity reaches half maximum (t1/2), and the last column is the time point when fluorescence reaches plateau. No obvious AnV-CF 594 signal can be detected in pHi 6.1 over 40 min. The recording interval is 10 s. See also Video 3. (B) The time courses of AnV fluorescence intensity for TMEM16F activated by 5 µM Ca2+ under different pHi values in A. The smooth curves represent fits to the logistic equation similar to Fig. 2 B. (C) The scrambling onset time (ton) at different pHi values under 5 µM Ca2+. N/S at pHi = 6.1 represents no scrambling. Error bars represent SEM (n = 5). (D) The t1/2 at different pHi values under 5 µM Ca2+. N/S at pHi = 6.1 represents no scrambling. Error bars represent SEM (n = 5). (E) The slopes at different pHi values under 5 µM Ca2+. (F) Representative images of TMEM16F-eGFP scrambling activity under 1,000 µM intracellular Ca2+ with different pHi. For the AnV-CF 594 signal on the right, the first column is fluorescence signal immediately after forming whole-cell configuration; the second column is the time point when fluorescence intensity reaches half maximum (t1/2), and the last column is the time point when fluorescence reaches plateau. See also Video 4. (G) Time courses of AnV fluorescence intensity for TMEM16F activated by 1,000 µM Ca2+ under diff,erent pHi values in F. The smooth curves represent fits to the logistic equation. (H) The scrambling onset time (ton) at different pHi values under 1,000 µM Ca2+. Error bars represent SEM (n = 5). (I) The t1/2 of lipid scrambling at different pHi values under 1,000 µM Ca2+. (J) The slopes (k) at different pHi values under 1,000 µM Ca2+. Error bars represent SEM (n = 5). Statistics were analyzed using one-way ANOVA followed by Tukey’s test. **, P < 0.01; ***, P < 0.001; ns (not significant), P > 0.05.

