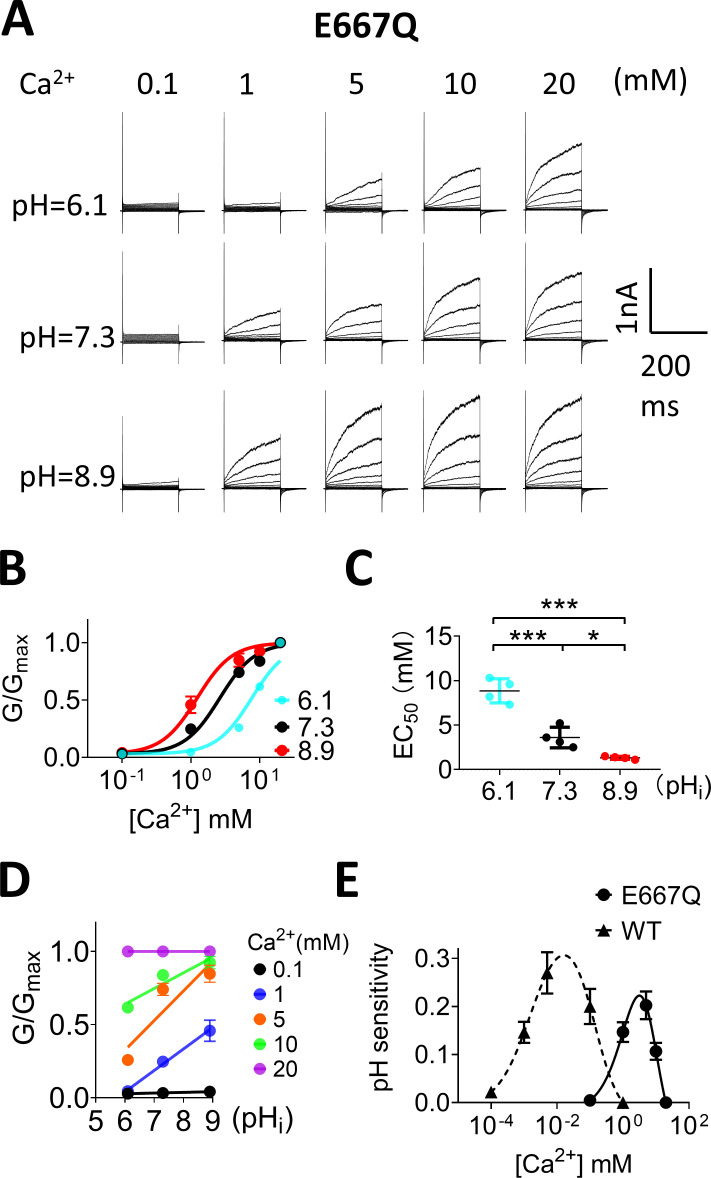
Figure 6.
Ca2+ binding sites mediate pHi regulation on TMEM16F. (A) Representative TMEM16F-E667Q currents recorded from inside-out patches perfused with intracellular solutions containing 0.1, 1, 5, 10, and 20 mM Ca2+ at different pHi values. (B) Ca2+ dose–response of TMEM16F-E667Q mutation. The error bars represent SEM (n = 4). (C) EC50 values of Ca2+ at pHi 6.1, 7.3, and 8.9 were 8.64 ± 1.08, 2.93 ± 0.42, and 1.22 ± 0.31 mM, respectively. The error bars represent SEM (n = 4). P values were determined with Tukey test comparisons after one-way ANOVA: ***, P < 0.001; *, P < 0.5. (D) The G-pHi relationship of TMEM16F-E667Q. Solid lines represent linear fits. (E) The pHi sensitivity and [Ca2+]i concentration relationship of E667Q (solid line). The peak pH sensitivity is 0.22 at ∼3.01 mM Ca2+. The error bars represent SEM (n = 4). Curve from WT (dashed line) was replotted here for reference.

