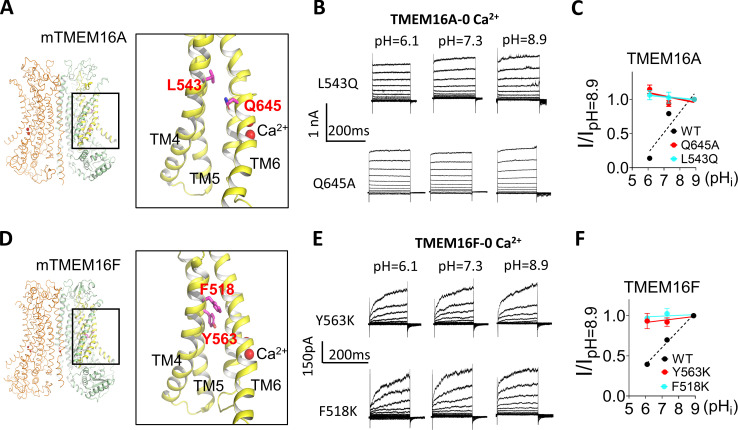
Figure S6.
pHi has no effect on the gain-of-function TMEM16A and TMEM16F mutations when Ca2+ is absent. (A) Locations of L543 and Q645 on the TMEM16A structure (PDB 5OYB). The residue numbers correspond to TMEM16A (a). For TMEM16A (ac) splice variant, the residue numbers are L547 and Q649, respectively. (B) Representative TMEM16A-L543Q and TMEM16A-Q645A currents recorded from inside-out patches perfused with intracellular solutions containing 0 Ca2+ at different pHi values. (C) I-pHi curve of TMEM16A mutations L543Q and Q645A at 100 mV. Slopes from linear fit for L543Q and Q645A are −0.02 and −0.04, respectively. The G-pHi curve of WT under 0.5 µM Ca2 was replotted as the black dashed line. Error bars represent SEM (n = 5). (D) Locations of Y563 and F518 on the TMEM16F structure (PDB 6QP6). (E) Representative TMEM16F-Y563K and TMEM16F-F518K currents recorded from inside-out patches perfused with intracellular solutions containing 0 Ca2+ at different pHi values (F) The I-pHi relationship of TMEM16F mutations Y563K and F518K at 100 mV. Slopes from linear fit for Y563K and F518K are 0.03 and 0.01, respectively. G-pHi curve of WT under 100 µM Ca2+ was replotted as black dashed line. Error bars represent SEM (n = 5). Note that the gain-of-function mutations do not have obvious tail current under 0 Ca2+; therefore, I-pHi relations not G-pHi were plotted to evaluate their pHi sensitivities.

