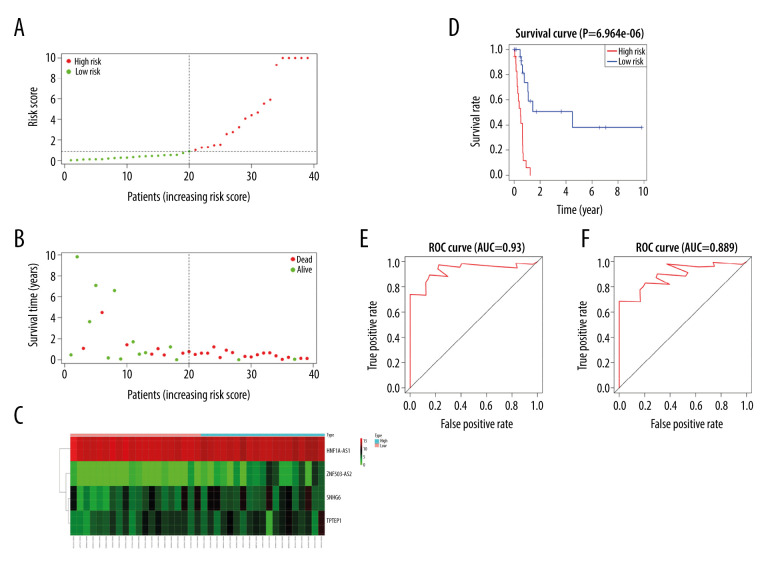
Figure 5.
(A) Risk score distributions of the 4 lncRNAs. (B) Overall survival of all RTK patients. (C) Expressions heat maps of the 4 lncRNAs in the low- and high-risk groups. (D) Kaplan-Meier survival curves for high- and low-risk RTK patients; red and blue lines represent high and low expression, respectively. (E, F) ROC curves for the lncRNA-constructed Cox risk regression model predicting the 3- and 5-year survival probability of RTK patients.

