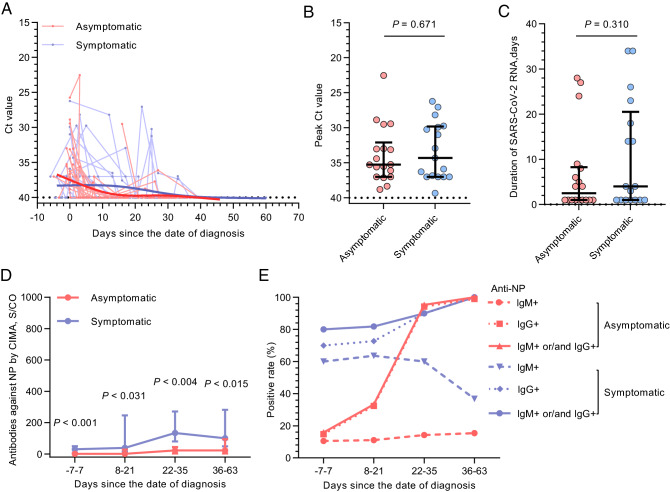
Fig. 4.
SARS-CoV-2 RNA and antibody dynamics in asymptomatic patients (n = 18) and symptomatic cases (n = 17). A Temporal profile of viral RNA load (inversely related to cycle threshold [Ct] value). Each line represents an individual patient. The thick line shows the trend in viral load using smoothing splines. B, C Peak viral RNA load (B) and persistence of viral RNA (C) in asymptomatic patients and symptomatic cases. D Antibodies against NP measured by CIMA. E Seropositivity of antibodies against NP at different intervals measured by ELISA. Results are shown as median and interquartile range; P values were derived from the Mann–Whitney U test.

