Figure 2.

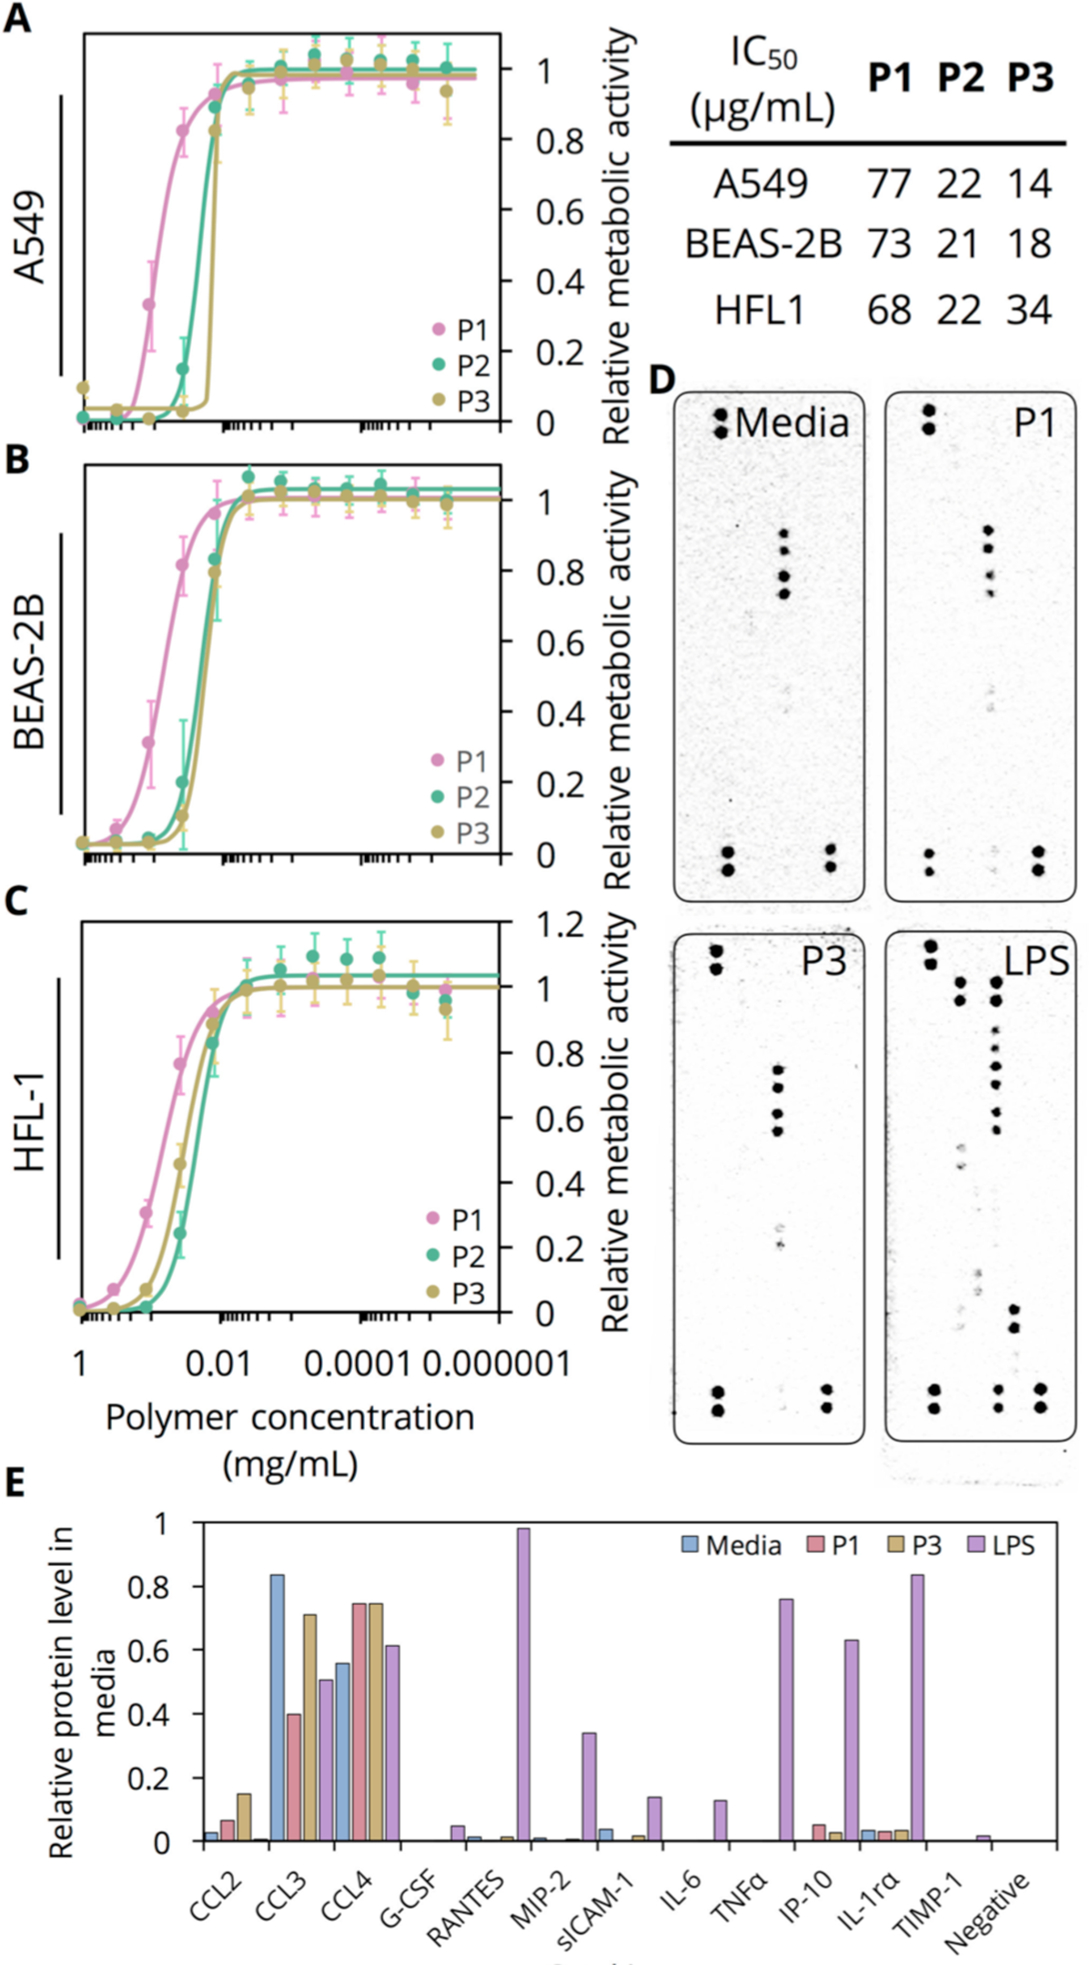
(A-C) MTS cell proliferation assay conducted on A549, BEAS-2B, and HLF-1 cells, respectively, exposed to P1-P3 for 24 hours (n=18, biological replicates). Hill functions fit to each curve to extract IC50 shown below corresponding graph. (D) Chemiluminescence images obtained (all 90 s exposure) for array panel membranes incubated with media of RAW 264.7 cells exposed to either media alone (negative control), P1, P3, or LPS (positive control). (E) Densitometric quantification of chemiluminescence signal.
