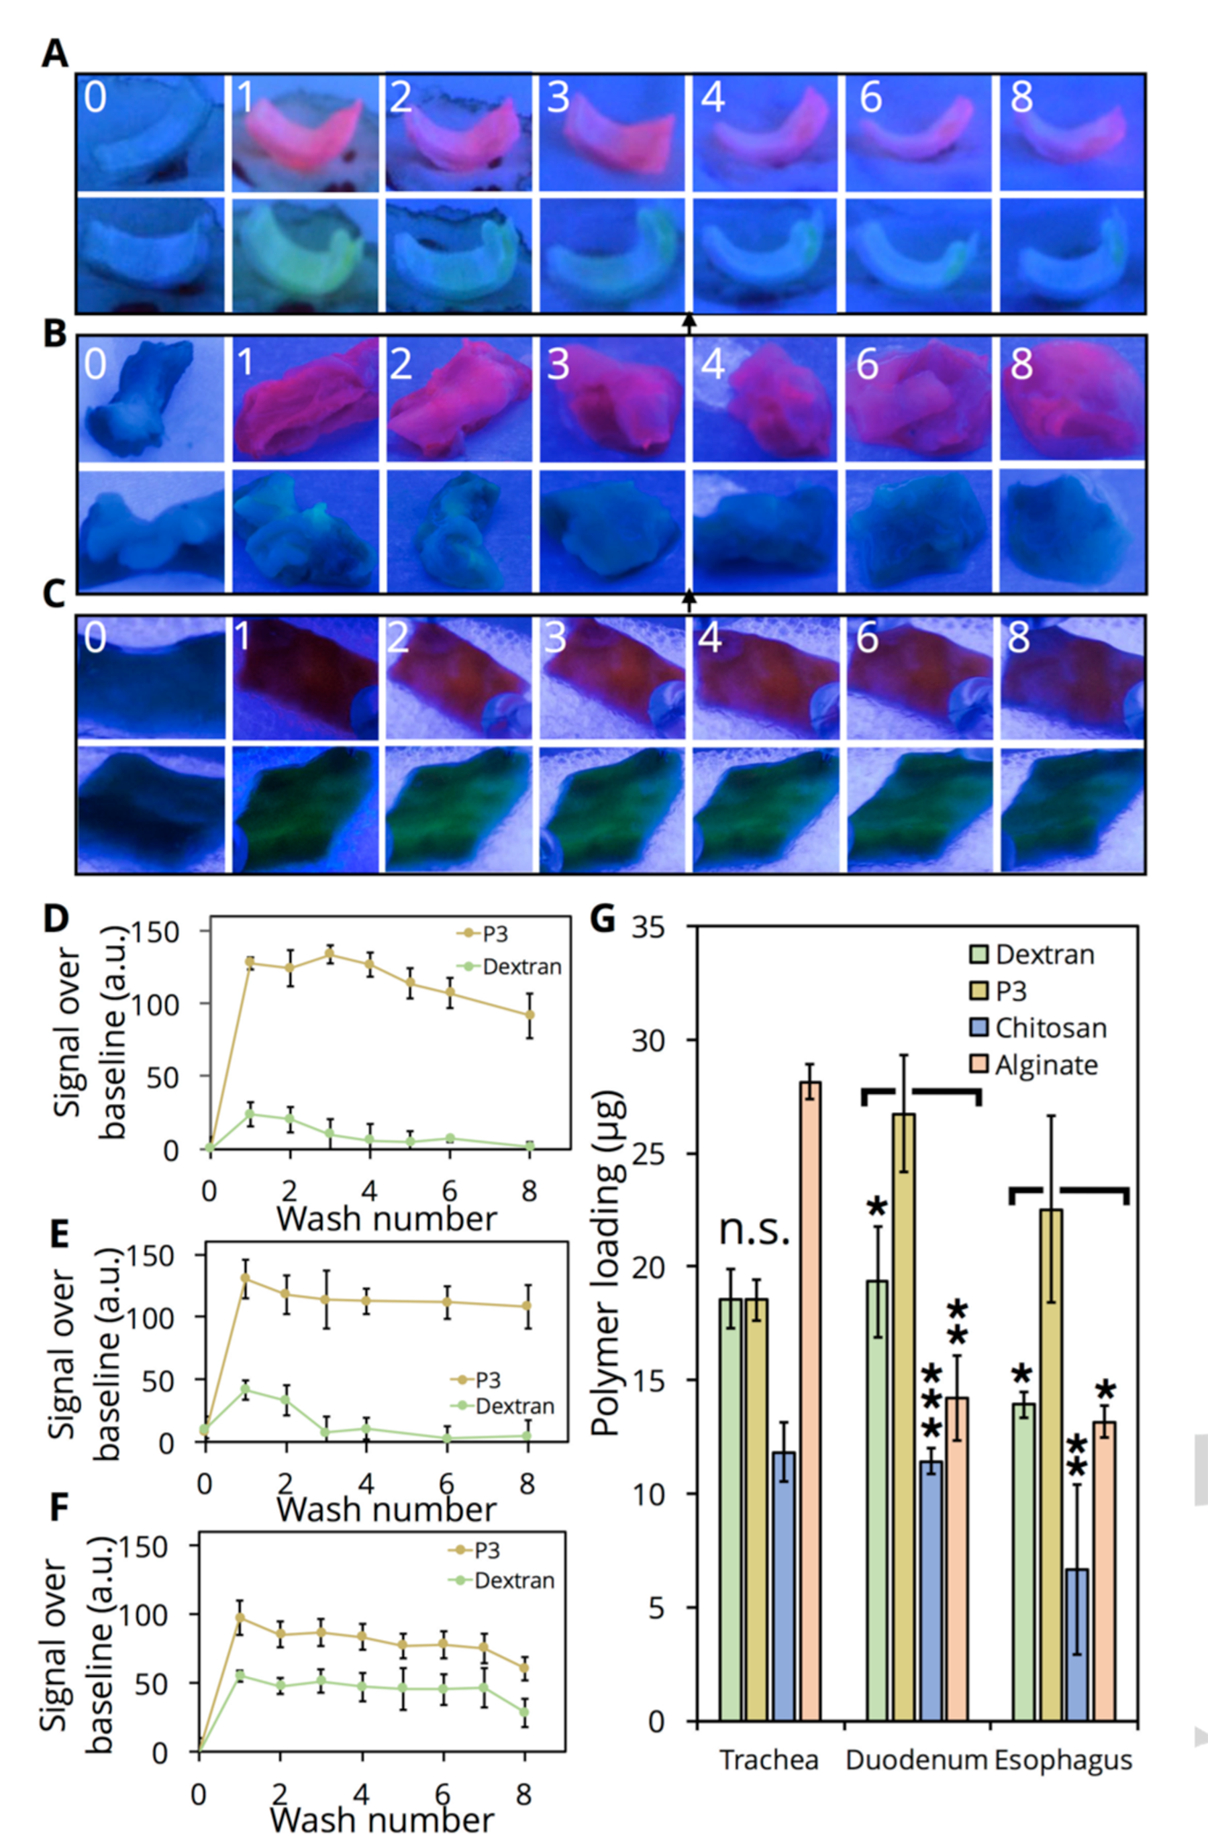
Figure 5.

(A-C) Images under UV irradiation (fixed illumination distance) of porcine trachea (A), ovine esophagus (B), and porcine duodenum (C) collected from a freshly sacrificed animal (0) and incubated with either TAMRA-P3 or FITC-dextran for 30 minutes (1) and washed up to 7 times afterwards (2–8). Images are of the same sample over each wash. (D-F) Quantification of images, split into RGB channels and followed by densitometry, obtained for each tissue sample (n=3). Values obtained relative to samples in PBS only to account for background. Error bars represent the variability in densitometry between independent tissue samples. (G) Tissue loading of FITC-dextran, FITC-alginate, FITC-chitosan, or TAMRA-P3. Tissue samples incubated with polymer for 30 minutes followed by vigorous sonication to remove bound polymer; fluorescence quantified via plate reader against standard curve (n=3 tissue samples). Error bars are standard deviation (n.s., p> 0.05; *, p < 0.05; **, p < 0.01, ***, p < 0.001).
