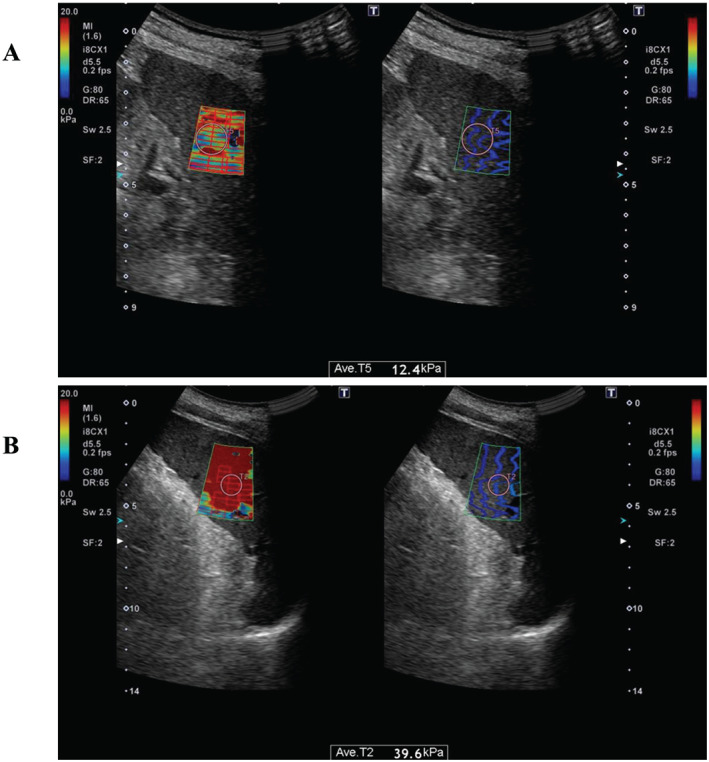
Figure 1.

Images of two‐dimensional shear wave elastography for measurement of spleen stiffness (SS). The examiner places a region of interest into the rectangular box at middle portion of spleen in the elastogram map (left). The propagation map on the right was used as a reference to confirm the quality of the elastogram map. (A) Image of a patient in the low SS group. The median SS was 12.4 kPa. (B) Image of a patient in the high SS group. The median SS was 39.6 kPa.
