
Figure 3.
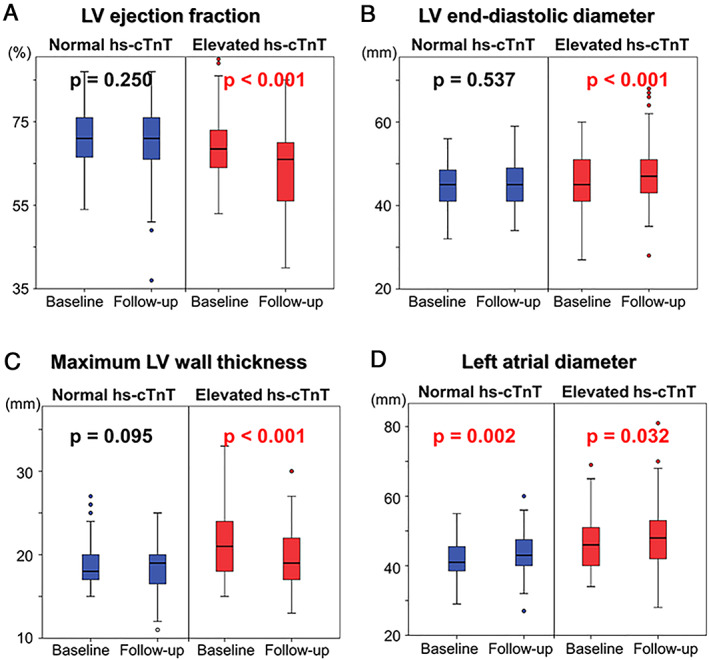
(A) Changes of LV ejection fraction in the normal hs‐cTnT group and elevated hs‐cTnT group. (B) Changes of LV end‐diastolic diameter in the normal hs‐cTnT group and elevated hs‐cTnT group. (C) Changes of maximum LV wall thickness in the normal hs‐cTnT group and elevated hs‐cTnT group. (D) Changes of left atrial diameter in the normal hs‐cTnT group and elevated hs‐cTnT group. LV, left ventricular; Hs‐cTnT, high‐sensitivity cardiac troponin T.