FIGURE 5.

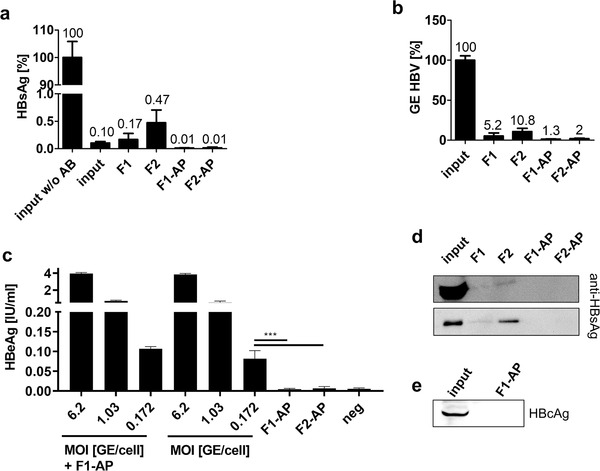
EVs purified by both size‐exclusion chromatography and affinity‐based purification are devoid of Hepatitis B Virus components. Plasma samples containing 3.1 × 10⁸ GE HBV and 767 μg anti‐HBsAg per ml plasma were subjected to SEC and affinity‐based purification. (a) HBsAg determined in input (plasma, HBV + anti‐HBsAg) and purified plasma samples is given as a percentage of input concentration. Samples correspond to 60 μl starting plasma each. Data represent three independent experiments in duplicates. (b) GE HBV determined in input and purified samples by qRT‐PCR is given as a percentage of input concentration. Samples correspond to 2.9 μl starting plasma each. Data represent three independent experiments in technical triplicates. (c) HepG2‐NTCP cells were treated with HBV in decreasing MOI, starting with an MOI of 6.2 vp/cell in six‐fold dilutions, and F1‐AP (MOI 0.174 vp/cell) and F2‐AP (MOI 0.266 vp/cell). HBeAg levels were measured by ELISA on day 5 post infection. Graph combines three independent experiments in duplicates. *** P < 0.001 (d) Western blot analysis of residual anti‐HBsAg contaminations. Samples correspond to 6 μl starting plasma each (upper gel and individual samples F1, F2, F1‐AP and F2‐AP lower gel) or 0.02 μl starting plasma (input sample lower gel). One representative Western Blot out of three independent experiments is shown. (e) Western blot analysis of HBcAg. Samples were loaded at volumes corresponding 260 μl starting plasma each. One representative Western blot out of three independent experiments is shown
