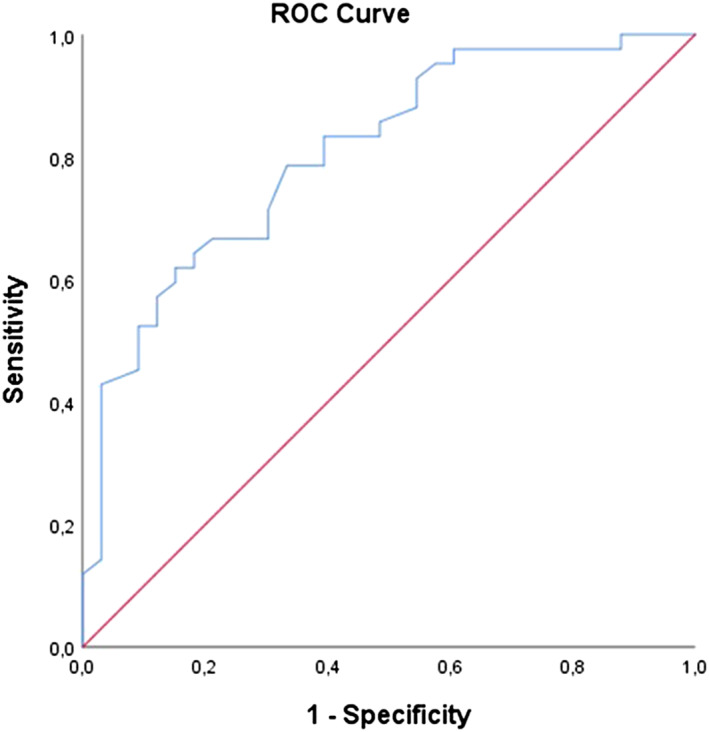
Figure 3.

ROC curve for the prediction model for cardiac dysfunction in obesity patients. Model; combination of SDNN, SDNN index, gender, ALAT, glucose, and triglycerides. Area under the curve = 0.72 (95% CI: 0.61–0.82, P < 0.001). ALAT, alanine aminotransferase; ROC, receiver operating characteristic; SDNN, standard deviation of all NN intervals.
