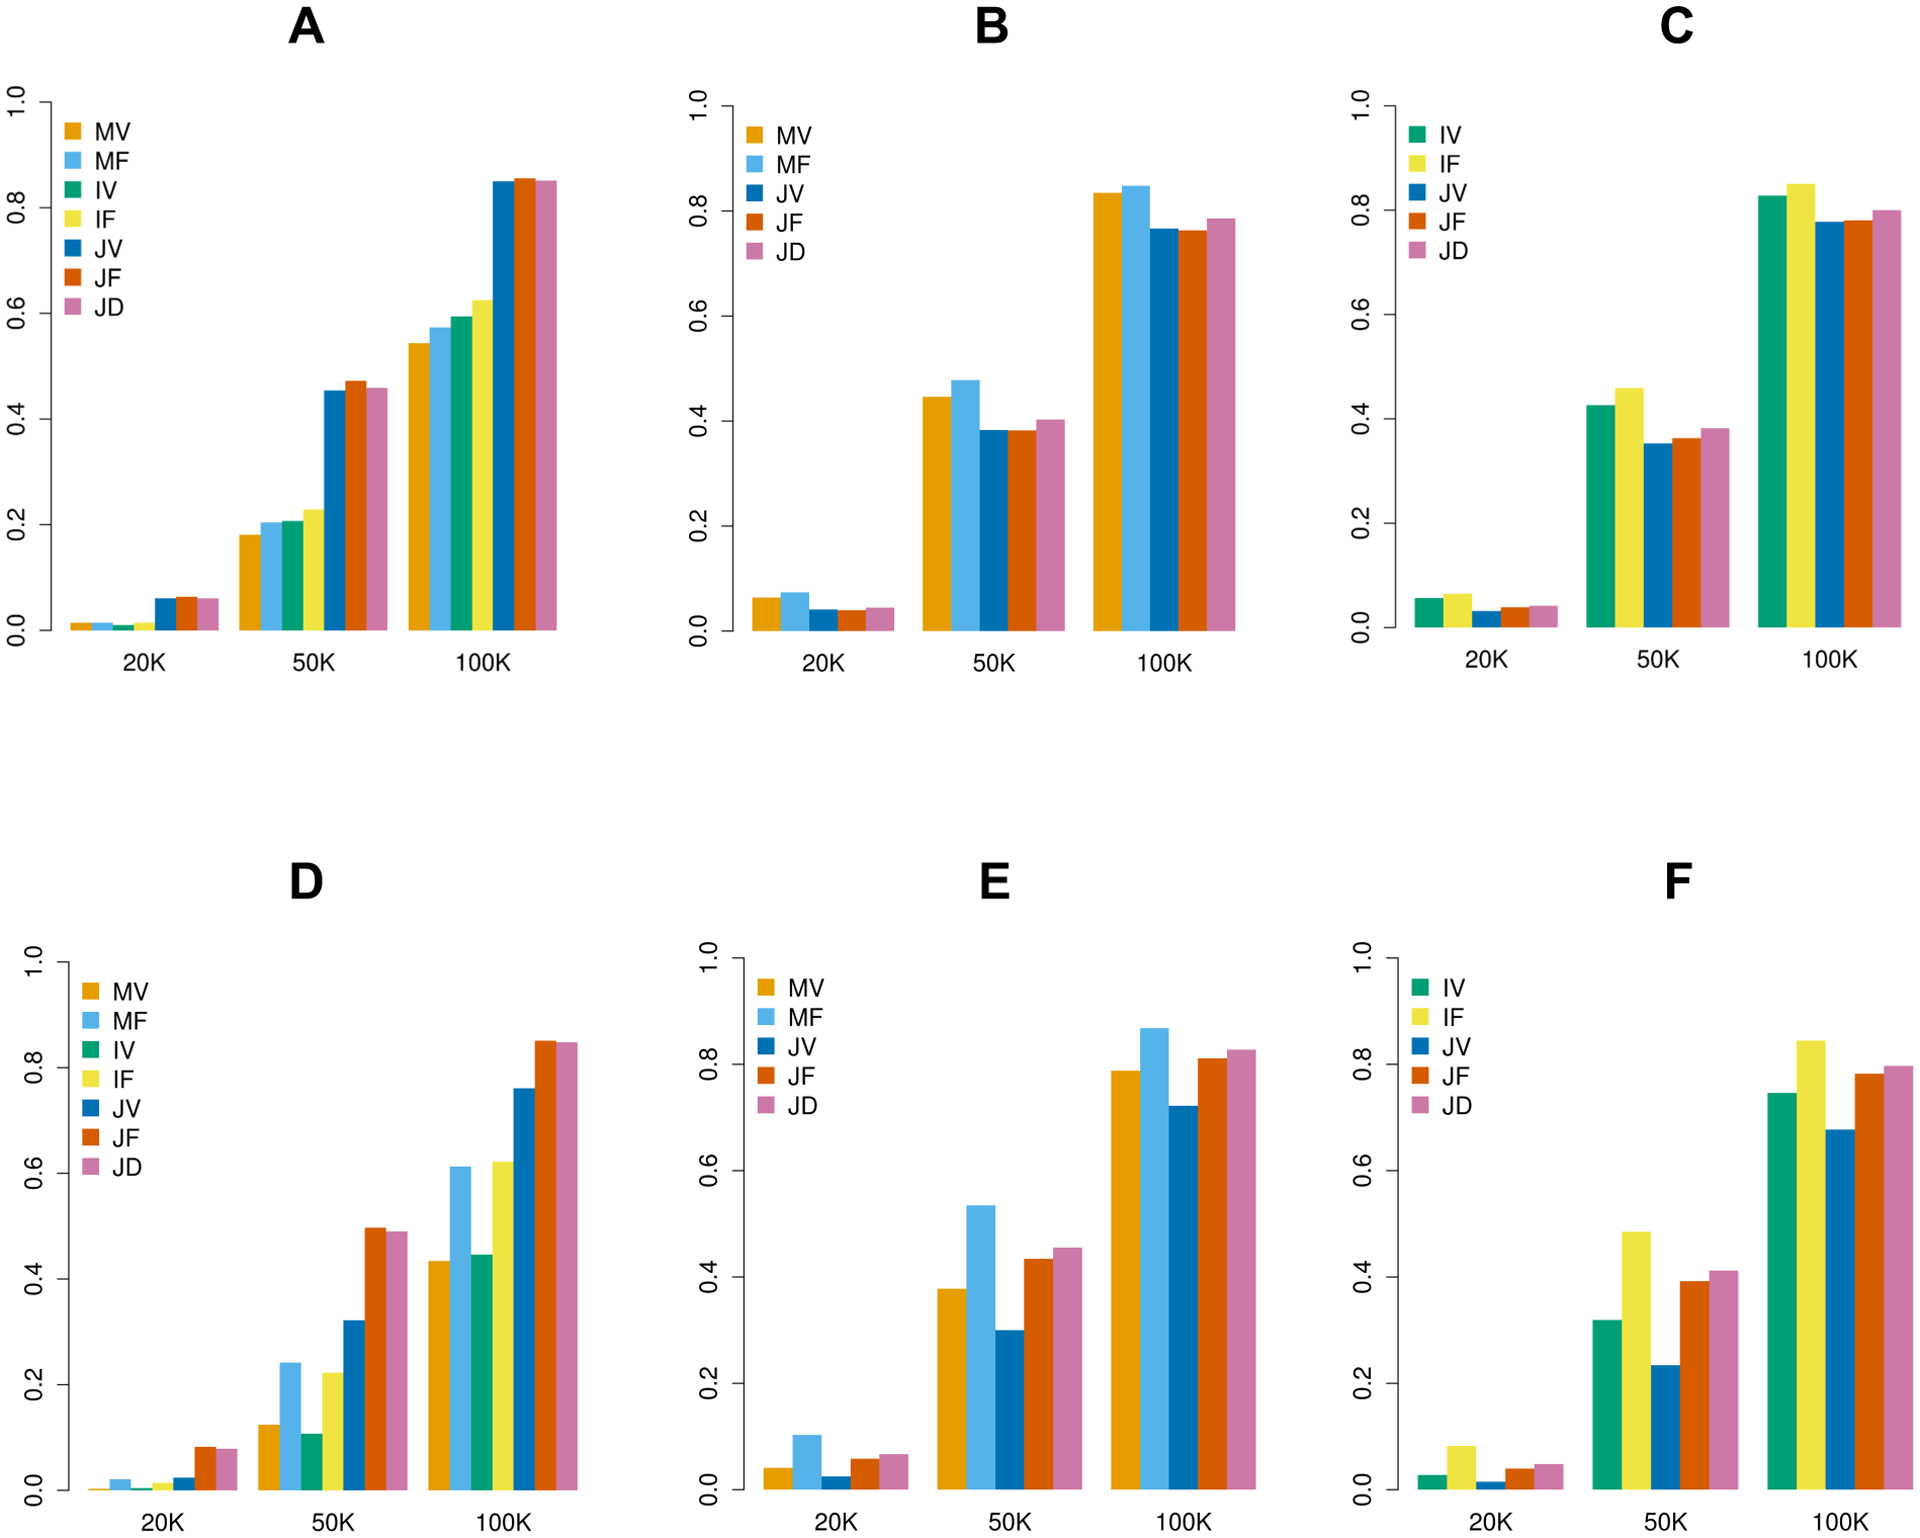
Figure 4.

Empirical power of MAGEE tests on quantitative traits in 20,000, 50,000, and 100,000 related samples. (A) Scenario 1: 80% null variants, 10% causal variants with positive effects and 10% causal variants with negative effects for both genetic main effects and GEI effects. (B) Scenario 2: 80% null variants, 10% causal variants with positive effects and 10% causal variants with negative effects for genetic main effects only. (C) Scenario 3: 80% null variants, 10% causal variants with positive effects and 10% causal variants with negative effects for GEI effects only. (D) Scenario 4: 80% null variants, 16% causal variants with positive effects and 4% causal variants with negative effects for both genetic main effects and GEI effects. (E) Scenario 5: 80% null variants, 16% causal variants with positive effects and 4% causal variants with negative effects for genetic main effects only. (F) Scenario 6: 80% null variants, 16% causal variants with positive effects and 4% causal variants with negative effects for GEI effects only.
