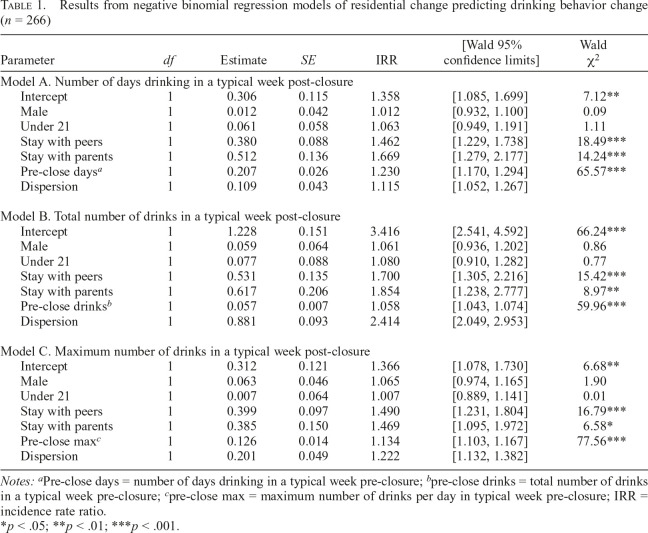
Table 1.
Results from negative binomial regression models of residential change predicting drinking behavior change (n = 266)
| Parameter | df | Estimate | SE | IRR | [Wald 95% confidence limits] | Wald χ2 |
|
| Model A. Number of days drinking in a typical week post-closure | |||||||
| Intercept | 1 | 0.306 | 0.115 | 1.358 | [1.085, 1.699] | 7.12** | |
| Male | 1 | 0.012 | 0.042 | 1.012 | [0.932, 1.100] | 0.09 | |
| Under 21 | 1 | 0.061 | 0.058 | 1.063 | [0.949, 1.191] | 1.11 | |
| Stay with peers | 1 | 0.380 | 0.088 | 1.462 | [1.229, 1.738] | 18.49*** | |
| Stay with parents | 1 | 0.512 | 0.136 | 1.669 | [1.279, 2.177] | 14.24*** | |
| Pre-close daysa | 1 | 0.207 | 0.026 | 1.230 | [1.170, 1.294] | 65.57*** | |
| Dispersion | 1 | 0.109 | 0.043 | 1.115 | [1.052, 1.267] | ||
| Model B. Total number of drinks in a typical week post-closure | |||||||
| Intercept | 1 | 1.228 | 0.151 | 3.416 | [2.541, 4.592] | 66.24*** | |
| Male | 1 | 0.059 | 0.064 | 1.061 | [0.936, 1.202] | 0.86 | |
| Under 21 | 1 | 0.077 | 0.088 | 1.080 | [0.910, 1.282] | 0.77 | |
| Stay with peers | 1 | 0.531 | 0.135 | 1.700 | [1.305, 2.216] | 15.42*** | |
| Stay with parents | 1 | 0.617 | 0.206 | 1.854 | [1.238, 2.777] | 8.97** | |
| Pre-close drinksb | 1 | 0.057 | 0.007 | 1.058 | [1.043, 1.074] | 59.96*** | |
| Dispersion | 1 | 0.881 | 0.093 | 2.414 | [2.049, 2.953] | ||
| Model C. Maximum number of drinks in a typical week post-closure | |||||||
| Intercept | 1 | 0.312 | 0.121 | 1.366 | [1.078, 1.730] | 6.68** | |
| Male | 1 | 0.063 | 0.046 | 1.065 | [0.974, 1.165] | 1.90 | |
| Under 21 | 1 | 0.007 | 0.064 | 1.007 | [0.889, 1.141] | 0.01 | |
| Stay with peers | 1 | 0.399 | 0.097 | 1.490 | [1.231, 1.804] | 16.79*** | |
| Stay with parents | 1 | 0.385 | 0.150 | 1.469 | [1.095, 1.972] | 6.58* | |
| Pre-close maxc | 1 | 0.126 | 0.014 | 1.134 | [1.103, 1.167] | 77.56*** | |
| Dispersion | 1 | 0.201 | 0.049 | 1.222 | [1.132, 1.382] | ||
Notes:a: Pre-close days = number of days drinking in a typical week pre-closure;
pre-close drinks = total number of drinks in a typical week pre-closure;
pre-close max = maximum number of drinks per day in typical week pre-closure; IRR = incidence rate ratio.
p < .05;
p < .01;
p < .001.

