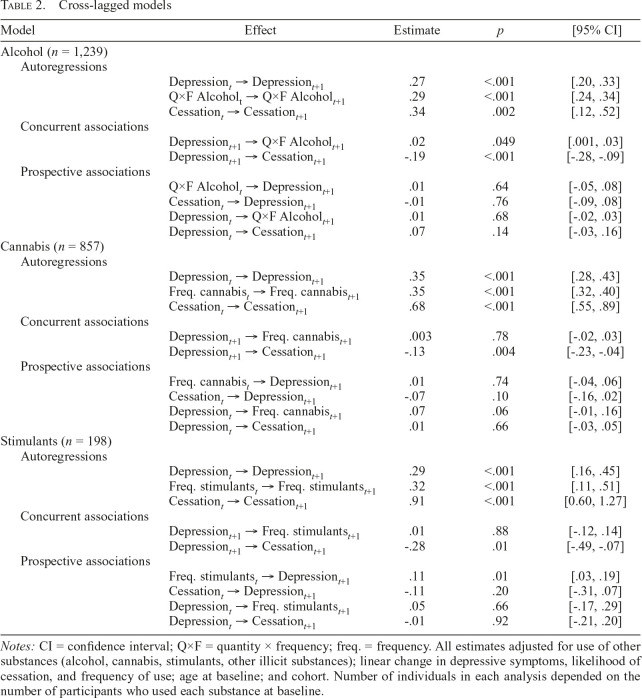
Table 2.
Cross-lagged models
| Model | Effect | Estimate | p | [95% CI] |
| Alcohol (n = 1,239) | ||||
| Autoregressions | ||||
| Depressiont → Depressiont+1 | .27 | <.001 | [.20, .33] | |
| Q×F Alcoholt → Q×F Alcoholt+1 | .29 | <.001 | [.24, .34] | |
| Cessationt → Cessationt+1 | .34 | .002 | [.12, .52] | |
| Concurrent associations | ||||
| Depressiont+1 → Q×F Alcoholt+1 | .02 | .049 | [.001, .03] | |
| Depressiont+1 → Cessationt+1 | -.19 | <.001 | [-.28, -.09] | |
| Prospective associations | ||||
| Q×F Alcoholt → Depressiont+1 | .01 | .64 | [-.05, .08] | |
| Cessationt → Depressiont+1 | -.01 | .76 | [-.09, .08] | |
| Depressiont → Q×F Alcoholt+1 | .01 | .68 | [-.02, .03] | |
| Depressiont → Cessationt+1 | .07 | .14 | [-.03, .16] | |
| Cannabis (n = 857) | ||||
| Autoregressions | ||||
| Depressiont → Depressiont+1 | .35 | <.001 | [.28, .43] | |
| Freq. cannabist → Freq. cannabist+1 | .35 | <.001 | [.32, .40] | |
| Cessationt → Cessationt+1 | .68 | <.001 | [.55, .89] | |
| Concurrent associations | ||||
| Depressiont+1 → Freq. cannabist+1 | .003 | .78 | [-.02, .03] | |
| Depressiont+1 → Cessationt+1 | -.13 | .004 | [-.23, -.04] | |
| Prospective associations | ||||
| Freq. cannabist → Depressiont+1 | .01 | .74 | [-.04, .06] | |
| Cessationt → Depressiont+1 | -.07 | .10 | [-.16, .02] | |
| Depressiont → Freq. cannabist+1 | .07 | .06 | [-.01, .16] | |
| Depressiont → Cessationt+1 | .01 | .66 | [-.03, .05] | |
| Stimulants (n = 198) | ||||
| Autoregressions | ||||
| Depressiont → Depressiont+1 | .29 | <.001 | [.16, .45] | |
| Freq. stimulantst → Freq. stimulantst+1 | .32 | <.001 | [.11, .51] | |
| Cessationt → Cessationt+1 | .91 | <.001 | [0.60, 1.27] | |
| Concurrent associations | ||||
| Depressiont+1 → Freq. stimulantst+1 | .01 | .88 | [-.12, .14] | |
| Depressiont+1 → Cessationt+1 | -.28 | .01 | [-.49, -.07] | |
| Prospective associations | ||||
| Freq. stimulantst → Depressiont+1 | .11 | .01 | [.03, .19] | |
| Cessationt → Depressiont+1 | -.11 | .20 | [-.31, .07] | |
| Depressiont → Freq. stimulantst+1 | .05 | .66 | [-.17, .29] | |
| Depressiont → Cessationt+1 | -.01 | .92 | [-.21, .20] |
Notes: CI = confidence interval; Q×F = quantity × frequency; freq. = frequency. All estimates adjusted for use of other substances (alcohol, cannabis, stimulants, other illicit substances); linear change in depressive symptoms, likelihood of cessation, and frequency of use; age at baseline; and cohort. Number of individuals in each analysis depended on the number of participants who used each substance at baseline.

