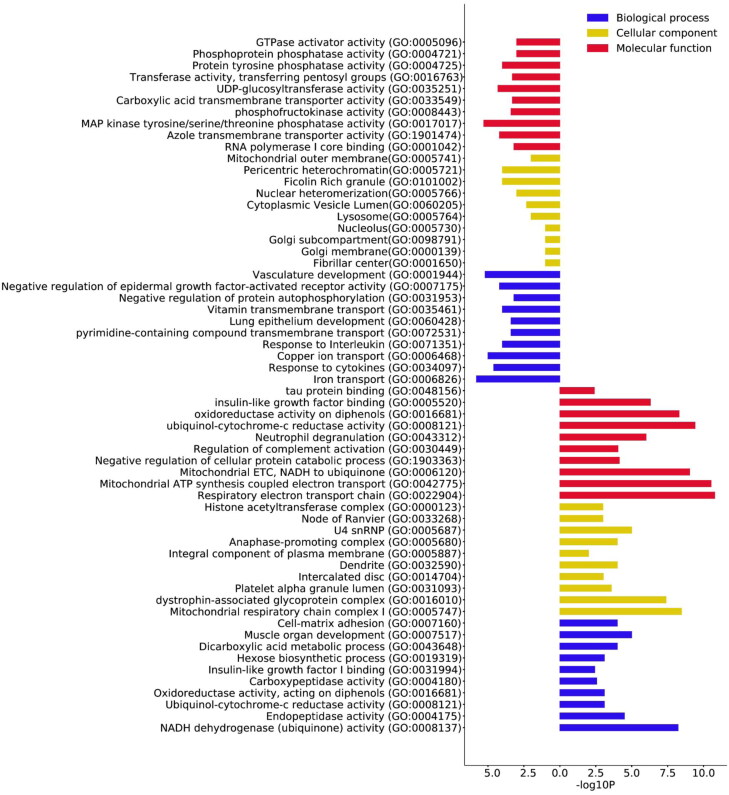
Figure 2.
Gene Ontology (GO) term enrichment analysis of upregulated DEGs. The top 10 annotations ranked based on p values are shown for three sub-ontologies, namely biological process, molecular function, and cellular component shown in the bars to the right. The top 10 downregulated annotations ranked based on p values are shown for three sub-ontologies, namely biological process, molecular function, and cellular component shown in the bars to the left.

