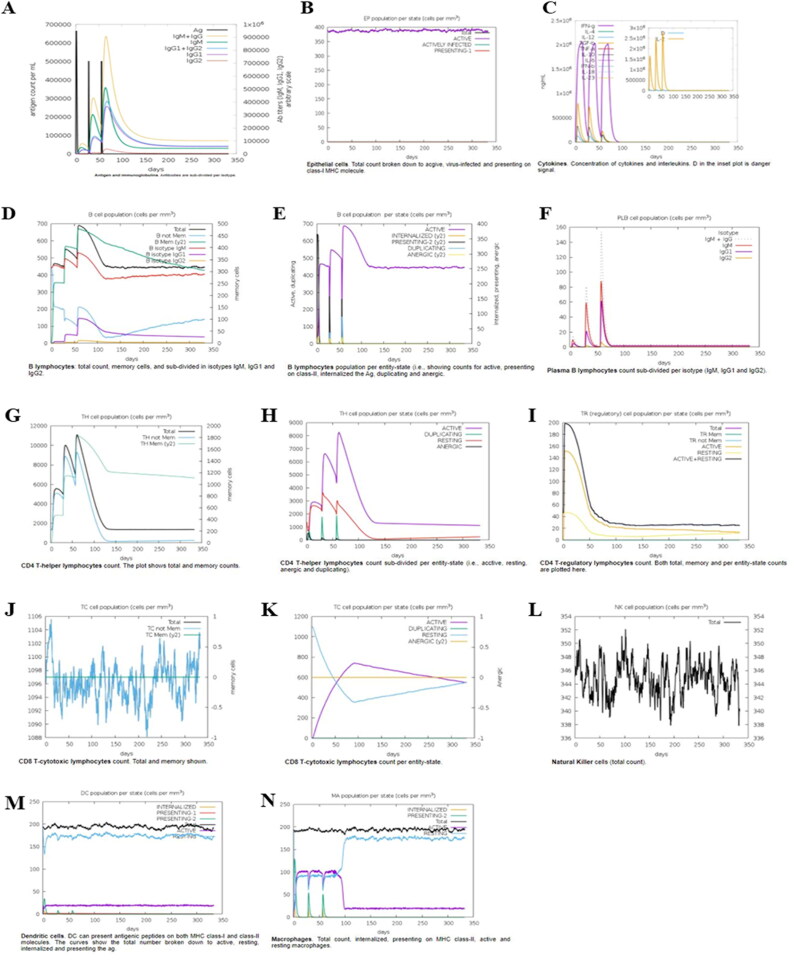
Figure 6.
In-silico immune response simulation by the candidate vaccine. The simulation is performed for three injections at time steps of 1, 84, and 100. Every step corresponds to 8 h of real-life. (A) Antigen and immunoglobulins (antibodies are sub-divided per isotype); (B) Epithelial-cell population per state; (C) Concentration of cytokines and interleukins; T helper (TH) cell population. (D) B-lymphocytes count; (E) B-lymphocytes count per entity-state; (F) Plasma B-cell population; (G) CD4 T-helper lymphocytes count; (H) CD4 T-helper lymphocytes count per entity-state; (I) CD4 T-regulatory lymphocytes count; (J) CD8 T-cytotoxic lymphocytes count; (K) CD8 T-cytotoxic lymphocytes count per entity-state; (L) Natural killer cells total count; (M) Dendritic cell (DC) can present antigenic peptides on both MHC class-I and class-II molecules; (N) Macrophage cell population.

