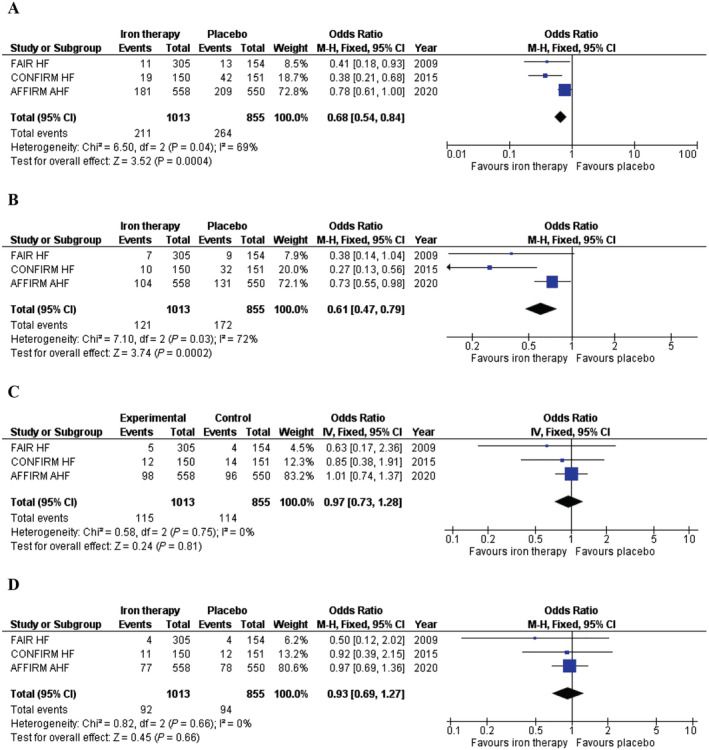
Figure 2.

Forest plot for dichotomous outcomes: (A) number of patients experiencing the composite endpoint of cardiovascular death or heart failure hospitalization; (B) number of patients who experienced heart failure hospitalizations during follow‐up; (C) all‐cause death; (D) cardiovascular death. M–H, Mantel–Haenszel; CI, confidence interval.
