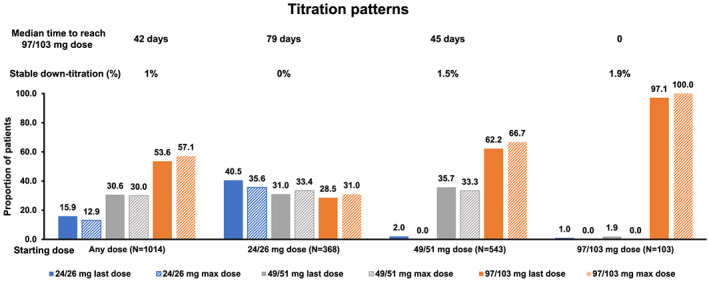
FIGURE A1.

Proportion of patients on sacubitril/valsartan treatment reaching the specified doses during the study period (sacubitril/valsartan overall national cohort).
Note: X ‐axis shows groups of starting doses (any, 24/26, 49/51, and 97/103 mg). N, number of sac/val patients with minimum of two filled sac/val prescriptions and 6 months follow‐up. Last dose, last dose within 6 months; Max dose, max dose within 6 months
