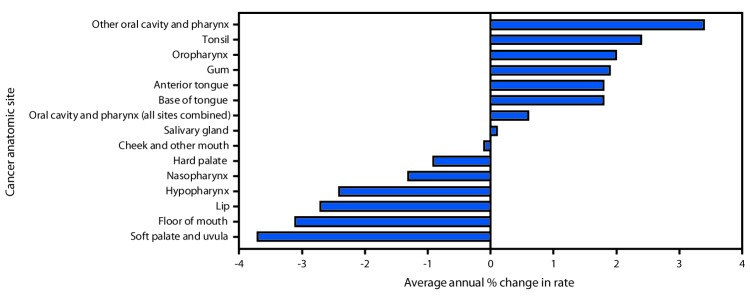
FIGURE.
Trends in incidence of cancers of the oral cavity and pharynx,*,†,§ by cancer anatomic site, United States, 2007–2016
* Cancer incidence data were compiled from cancer registries that meet the data quality criteria for all invasive cancer sites combined, representing 100% of the U.S. population.
† Annual percentage changes were statistically significant (at p<0.05) for all sites except “Salivary gland” and “Cheek and other mouth,” which had rates considered stable.
§ “Other oral cavity and pharynx” cancers included International Classification of Diseases for Oncology, Third Edition (ICD-O-3) codes C14.0 (Pharynx NOS), C14.2 (Waldeyers ring), and C14.8 (Overlapping lesion of lip, oral cavity, and pharynx).

