
FIGURE 2.
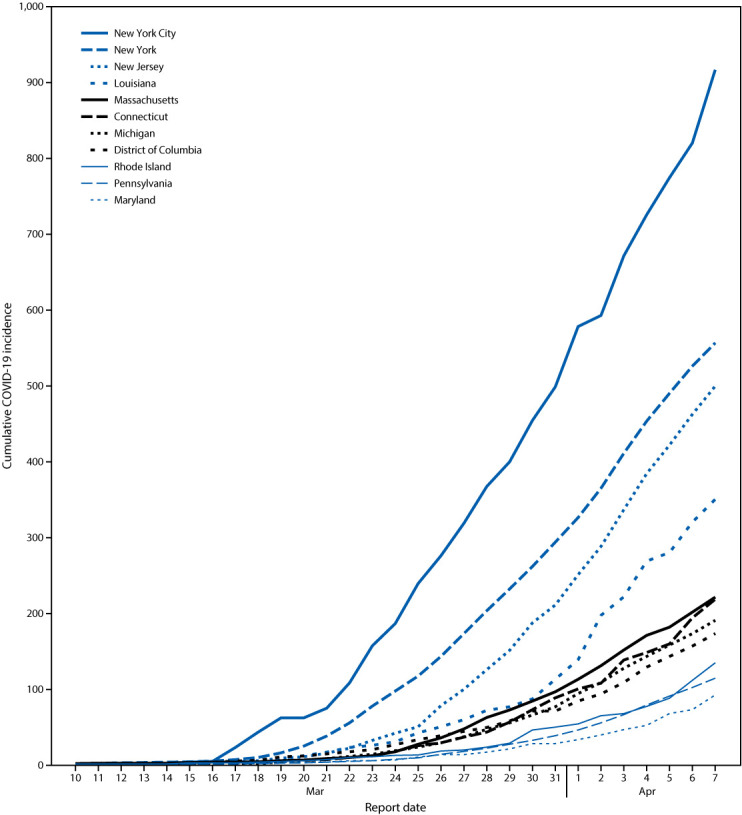
Cumulative incidence* of COVID-19, by report date — selected U.S. jurisdictions,†,§ March 10–April 7, 2020
Abbreviation: COVID-19 = coronavirus disease 2019.
* Cases per 100,000 population.
† Restricted to the 11 jurisdictions reporting the largest absolute increase in COVID-19 cumulative incidence during the most recent 7-day reporting period, March 31–April 7, 2020.
§ Data from New York are exclusive of New York City.