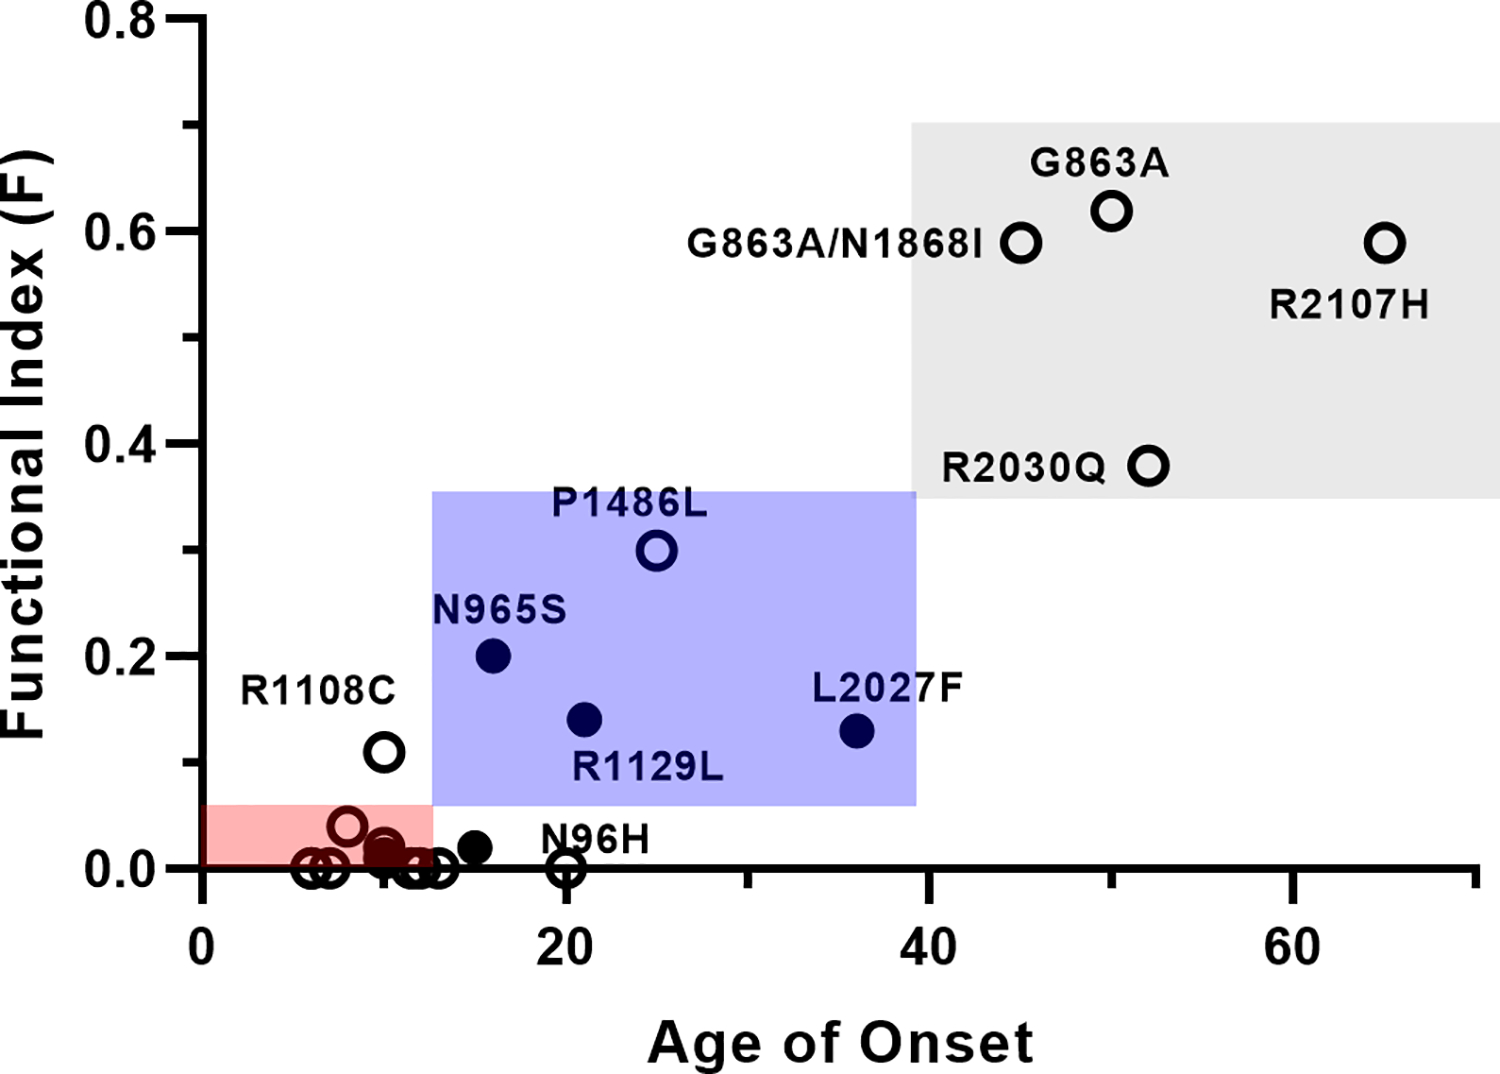
Figure 5:

Graph showing the relationship of the functional index (F) to the age of onset for ABCA4 variants found in homozygous STGD1 patients. The red square (lowest) shows the relationship between the range of age of onset and functional index classified as severe (Class 1); blue square (middle) is classified as moderate (Class 2); and the grey (upper) is classified as mild (Class 3). Fill circles are the average age of onset found for multiple patients as reported in the literature; the open circles are for a single patient. The severe patients with a F-index at or close to zero are not labeled, but can be found in Table I.
