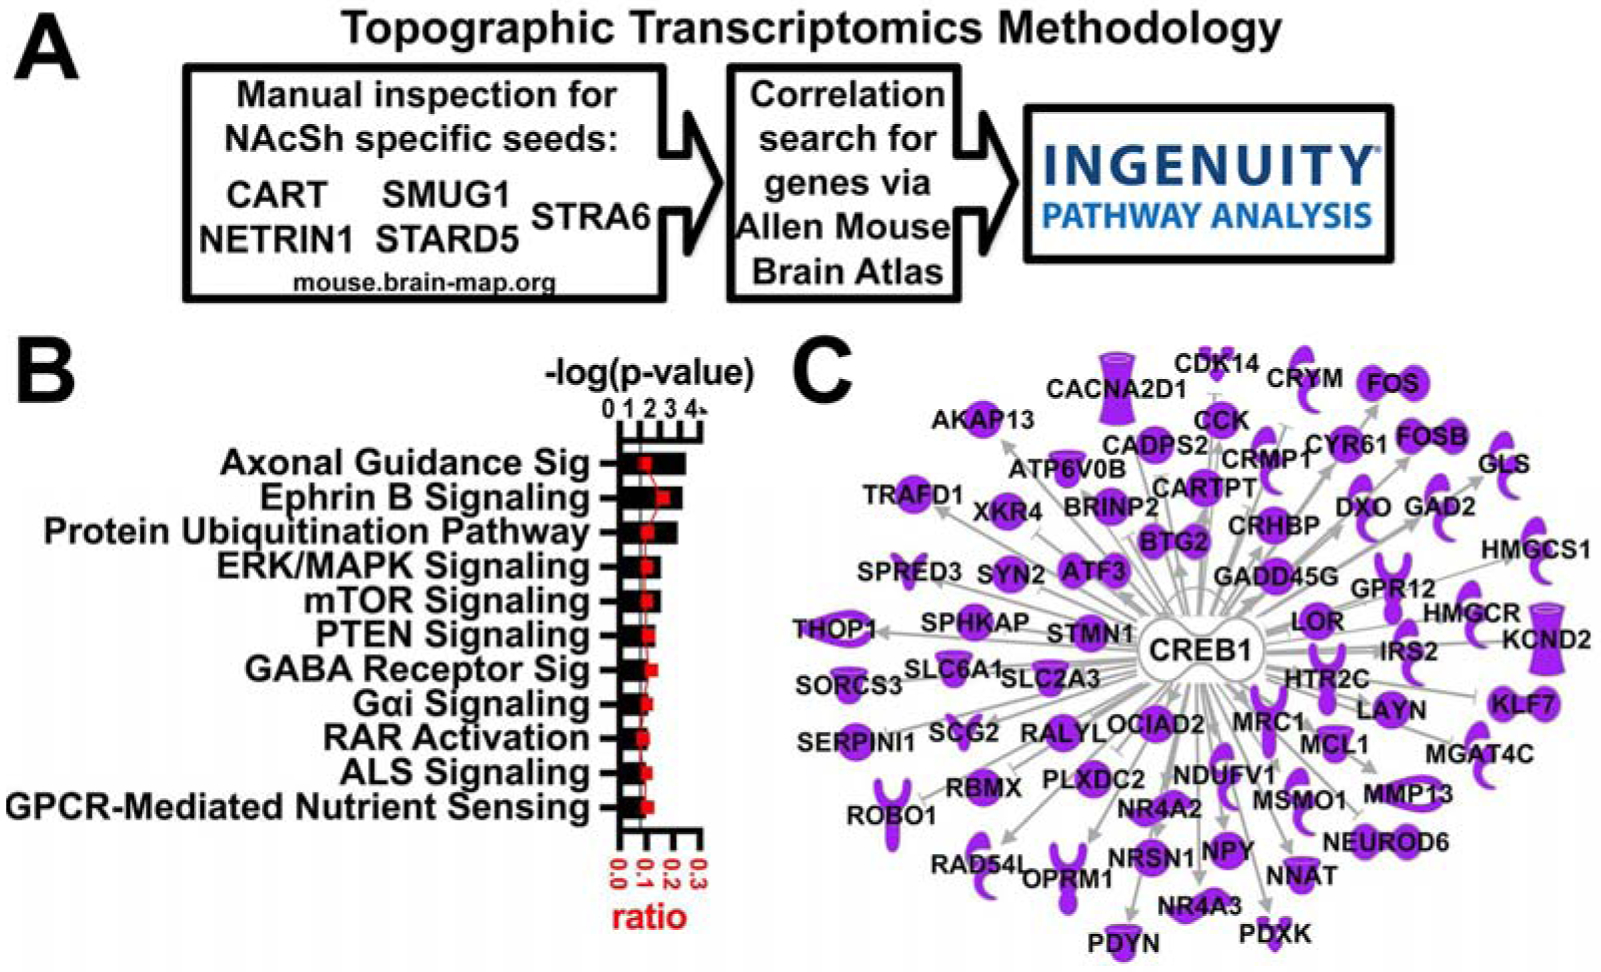
Figure 2: Topographic transcriptomic analysis of the nucleus accumbens shell.

A. Overview of topographic transcriptomics methodology. B. A selection of significant Canonical Pathways. Horizontal axis (bars) represents −log (p-value) and ratio (red squares) of NAcSh transcripts to all transcripts in the pathway. Black line represents threshold p = 0.05. C. CREB is identified as an upstream regulator.
