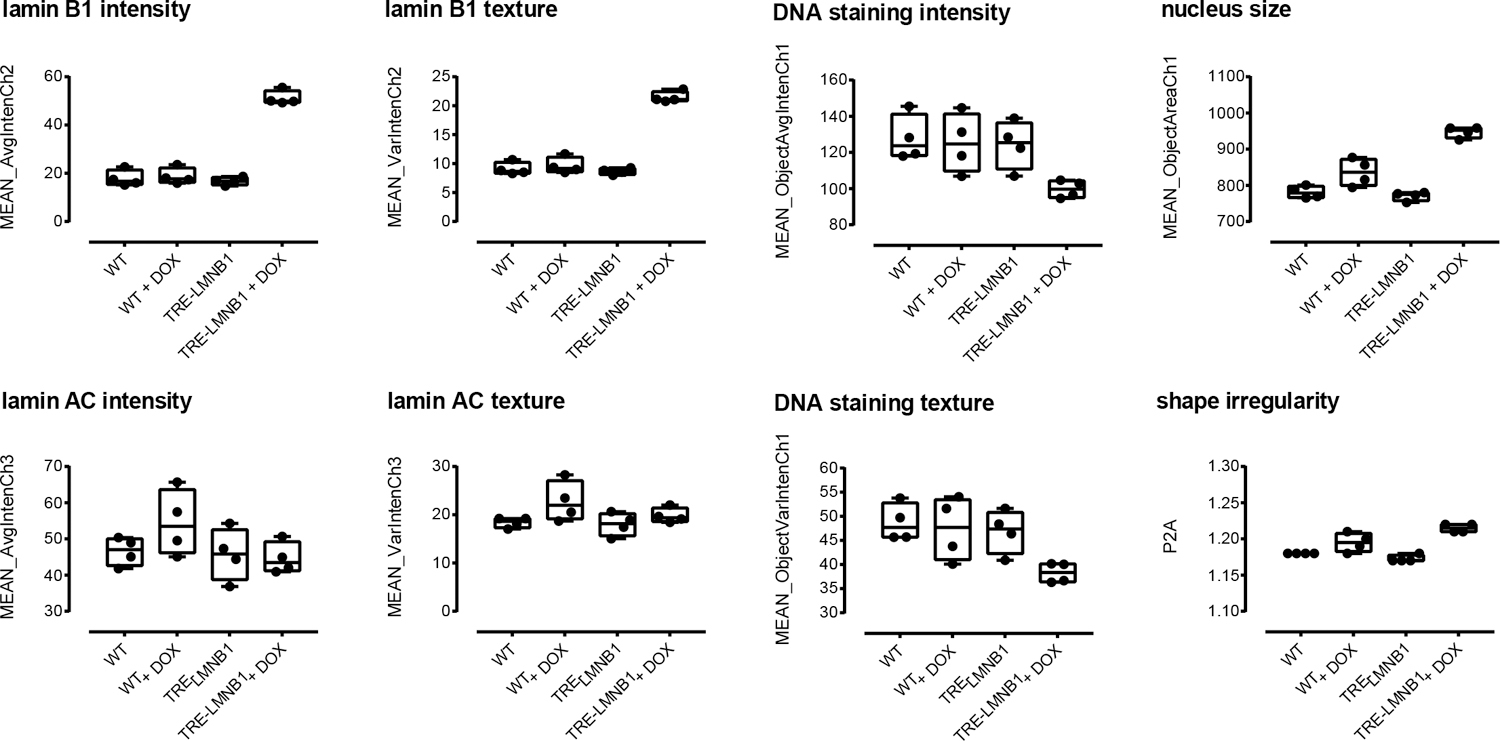
Figure 2. Initial quantification of lamin B1 expression and nuclear morphology by high-content analysis.

WT and TRE-LMNB1 MEF were cultured in 96 well plates for three days in the presence or absence of DOX and immunostained with anti-lamin B1/lamin A/C antibodies. Plates were scanned on an ArrayScan II HCS reader and analyzed for lamin expression and nuclear texture by the Target Activation Bioapplication as described in Materials and Methods. Each box plot shows the mean, first and third quartiles, and range of four wells from a single experiment that has been repeated at least three times.
