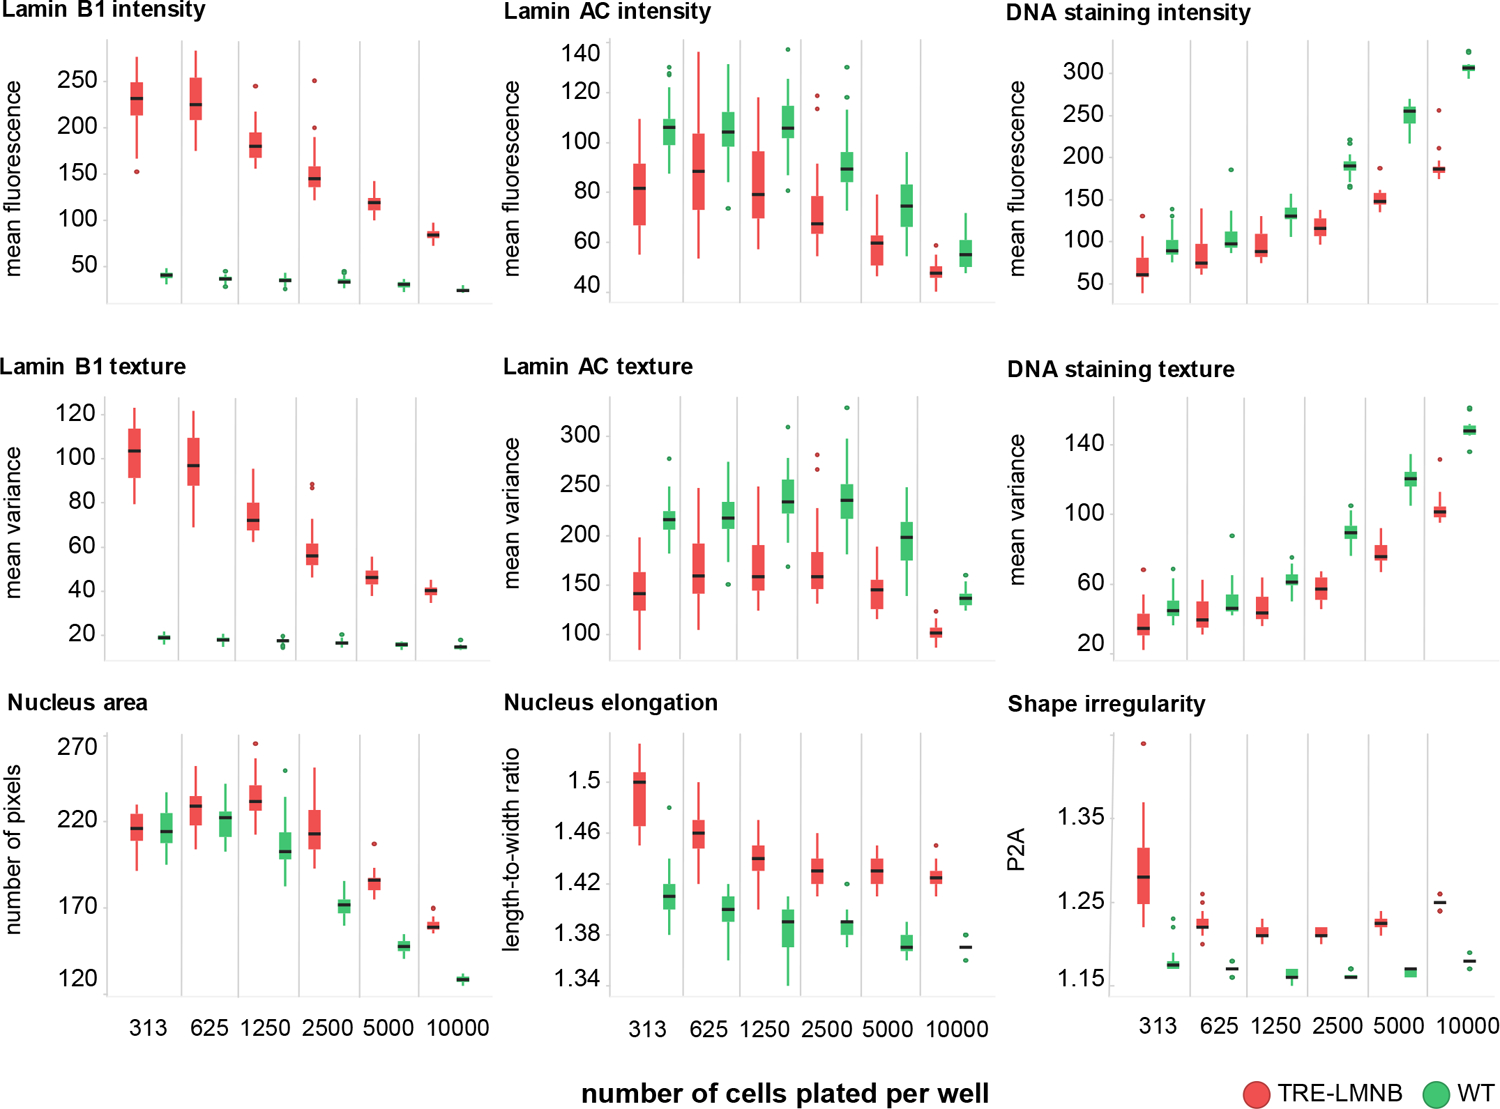
Figure 3. Effects of lamin B1 overexpresson are dependent on cell density.

WT or TRE-LMNB1 MEF were seeded at different densities and analyzed by HCA three days after DOX stimulation. Most parameters were strongly affected by cell density, however for some differences between WT and lamin B1 overexpressing MEFs were retained. Each box plot shows the mean, first and third quartiles, and range of 7–14 technical replicates from a single experiment that has been repeated twice. Green, WT ; red, TRE-LMNB1 MEF.
