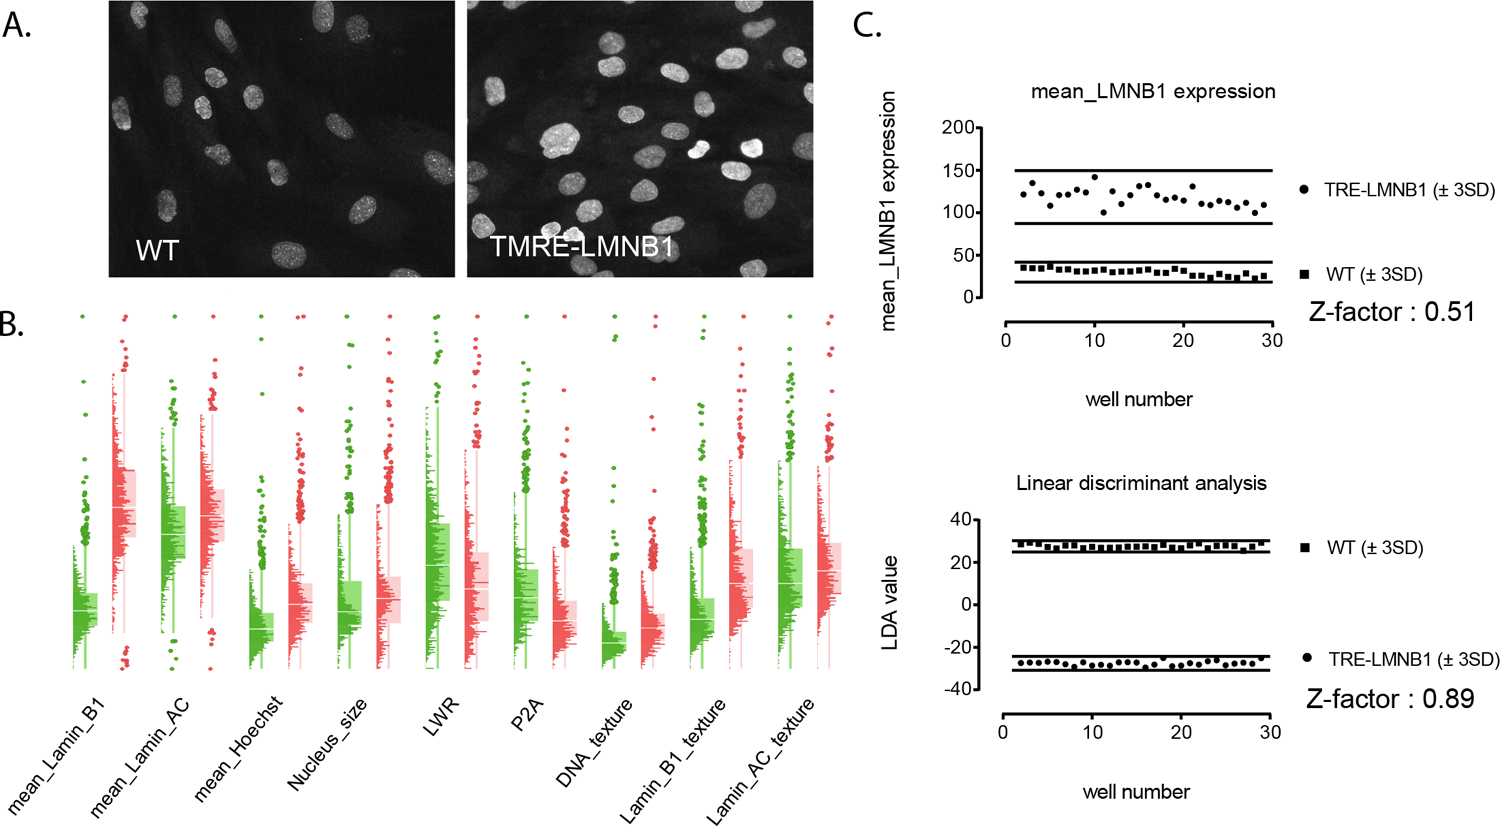
Figure. 4. Exploiting multiple features to fully capture complexity and heterogeneity of lamin B1 overexpression and associated nuclear abnormalities.

Images in A. show two randomly chosen fields of Lamin B1 stained nuclei from wild-type and transgenic MEFs that illustrate the heterogeneity of nuclear abnormalities. Images were taken with a 40X objective on an ImageXpress Ultra confocal HCS reader. B. Histo-Box plots expose dissimilarities in the distribution of cell and well features not easily appreciated by visual inspection. Green graphs are WT, and red graphs are TRE-LMNB1. Each plot is the aggregate of individual cells from 30 wells, with each well containing a minimum of 1,000 cells. Note that only a subset of parameters is shown for clarity; the full set of parameters can be found in Supplemental Table 1. C. Linear discriminant analysis of 24 cell and well features and three heterogeneity indices was used to integrate information from multiple features into a single readout that provided maximum separation between the two datasets, resulting in a dramatic improvement in assay performance compared with lamin B1 expression alone. Note that LDA returns identical absolute values for the two classes, therefore an S/B cannot be established.
