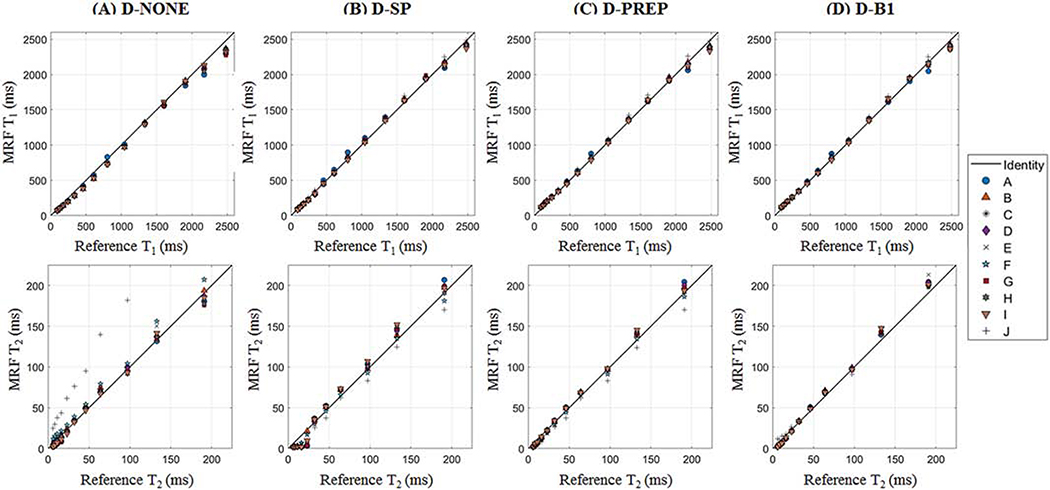
Figure 3:
Scatterplots of reference vs cMRF T1 and T2 measurements for different acquisition patterns, labeled A-J. The dictionary was simulated using (A) no corrections (D-NONE), (B) slice profile correction only (D-SP), (C) slice profile correction and the proposed method for simulating preparation pulses (D-PREP), and (D) slice profile correction, the proposed method for simulating preparation pulses, and B1+ correction (D-B1). The identity line is displayed on each plot.

