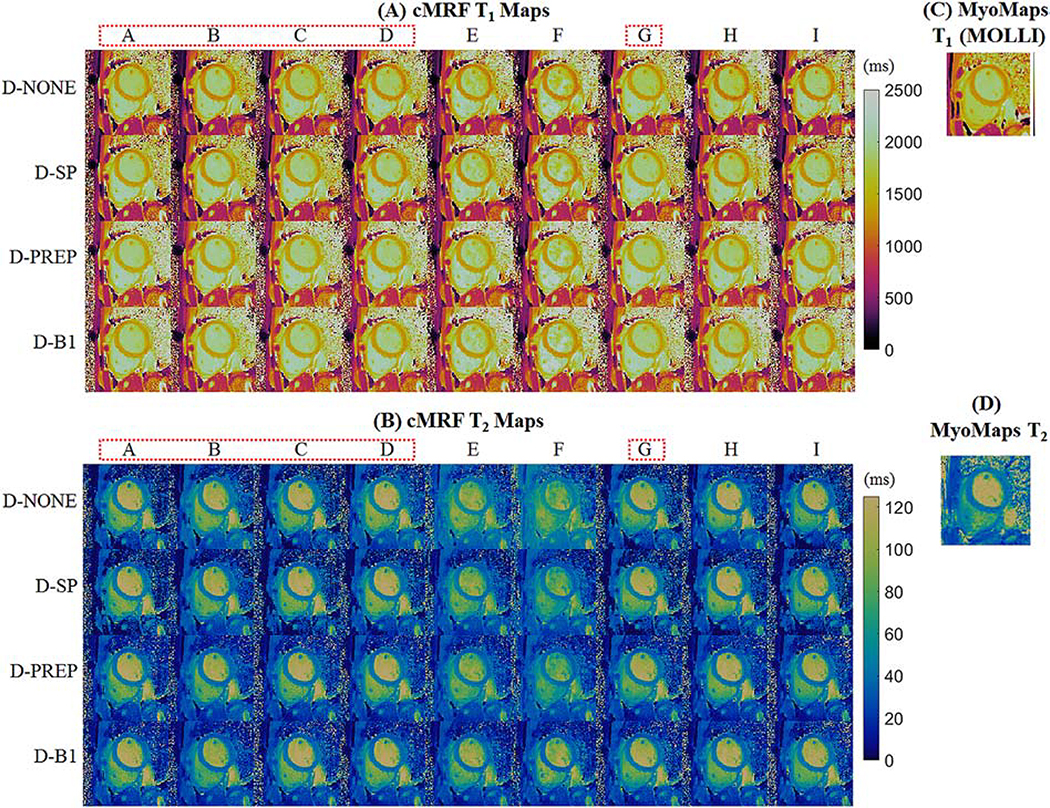
Figure 6:
Representative cMRF (A) T1 and (B) T2 maps from one volunteer at 3T. Maps are shown after matching to dictionaries with no additional corrections (D-NONE); slice profile correction (D-SP); slice profile and preparation pulse efficiency corrections (D-PREP); and slice profile, preparation pulse efficiency, and B1+ corrections (D-B1). The dotted red lines highlight those acquisition patterns which also produced acceptably low RMSEs in simulation and were robust to slice profile and B1+ effects. Conventional maps collected with (C) MOLLI and (D) T2-prepared FLASH are shown for comparison.

