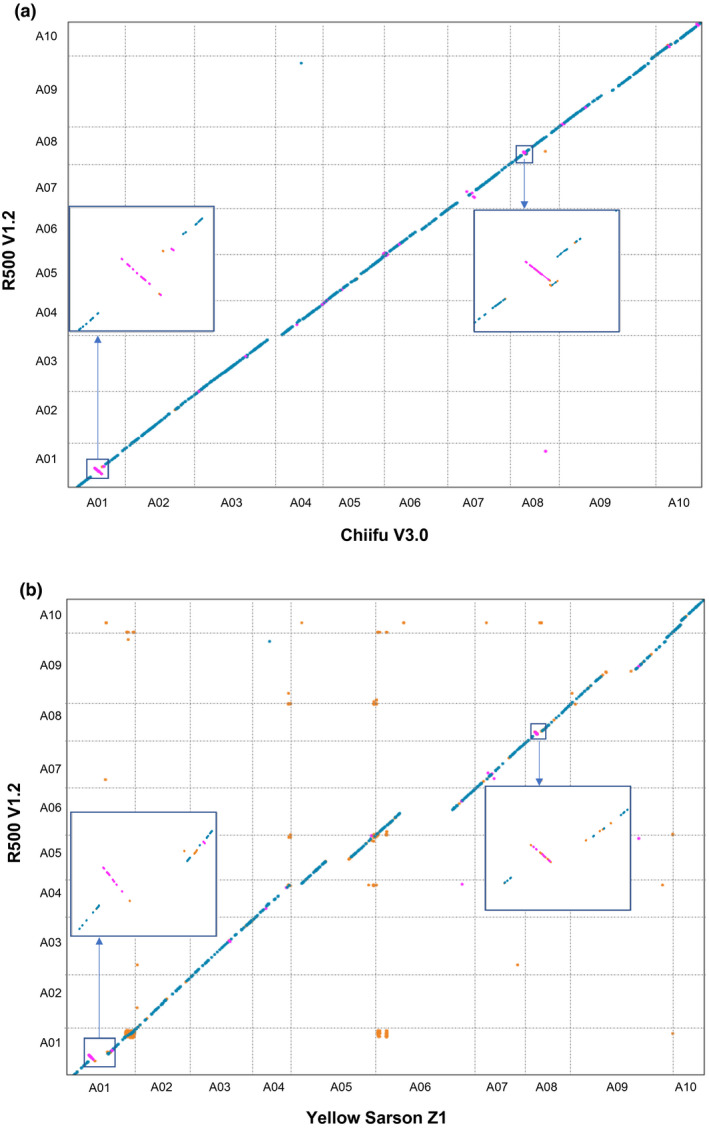
FIGURE 3.

Macrosyntenic comparisons of the R500 V1.2 assembly with Chiifu V3.0 (a) and Yellow sarson Z1 (b). Each black dot represents a syntenic gene pair between two genomes and deviations from diagonal lines between chromosome pairs denote structural variations, inversions or assembly errors between the genomes. Examples of these deviations are shown in the highlighted boxes.
