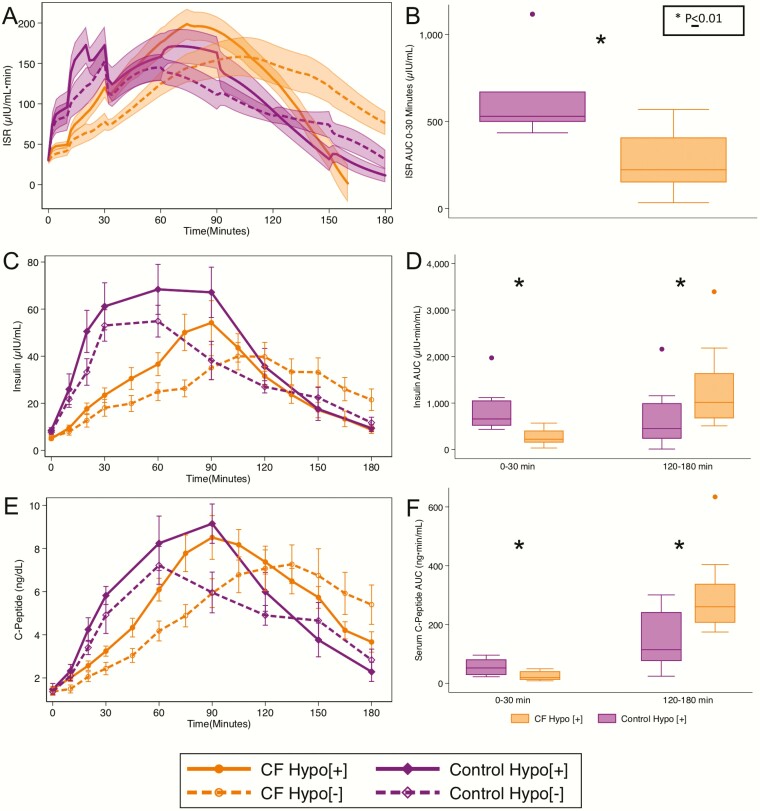
Figure 2.
(A) Insulin secretory rate (ISR), (C) plasma insulin, and (E) C-peptide in response to the OGTT. (B) ISR AUC0-30min, (D) insulin AUC0-30min & 120-180min, and (F) C-peptide AUC0-30min & 120-180min as measures of early responses and late effects during the OGTT. Data are means ± SE (A, C, E), and box plots represent the median, upper and lower quartiles, minimum and maximum except outliers (whiskers), and outliers (dots). Note that apparent discrepancy in median insulin AUC120-180min, for the CF-Hypo[+] group compared with the control-Hypo[+] group in the line graph versus box plot is related to the termination time for individuals with CF. AUC, area under the curve; CF, cystic fibrosis; Hypo, hypoglycemia; OGTT, oral glucose tolerance test; SE, standard error.

