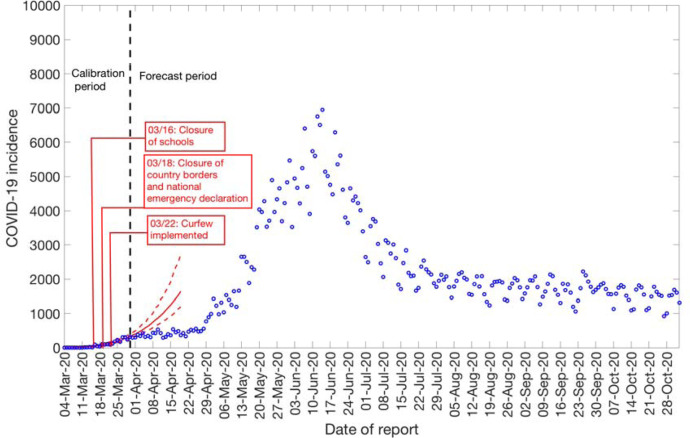
Figure 6:
20-days ahead forecast of the COVID-19 epidemic in Chile by calibrating the GGM model until March 30th, 2020. Blue circles correspond to the data points; the solid red line indicates the best model fit, and the red dashed lines represent the 95% prediction interval. The vertical black dashed line represents the time of the start of the forecast period.

