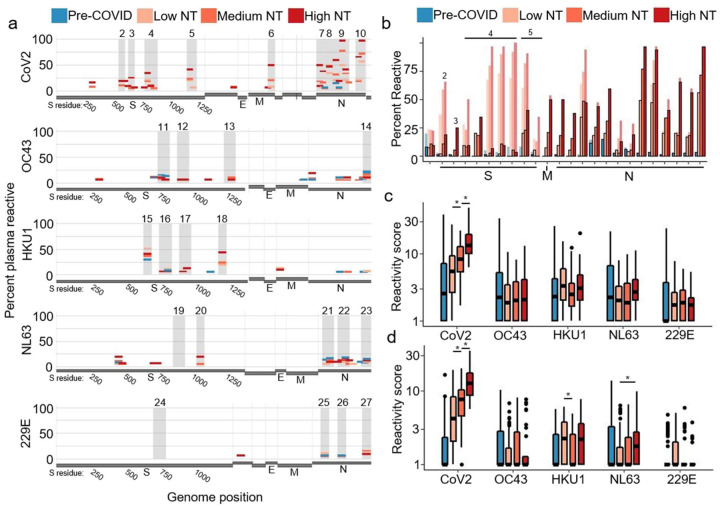
Figure 3. Deconvolution of convalescent plasma reactivities.
a. Following deconvolution, the percentage of samples in each sample group with target-preferred peptide reactivities were plotted along the viral genomes. Amino acid residue number is included for S.
b. The percentage of plasma in each sample group that had reactivity to dominant CoV2 peptides is shown before (light bars) and after (dark bars with outline) deconvolution.
c-d. Aggregate virus scores were calculated following deconvolution, using all peptides (c) or using only peptides from immunodominant regions (d). Bars with an asterisk indicate convalescent plasma groups that show significantly different scores (two sided wilcox test, p<0.05)

