. 2020 Dec 22;128(12):127011. doi: 10.1289/EHP6729

Figure 1.

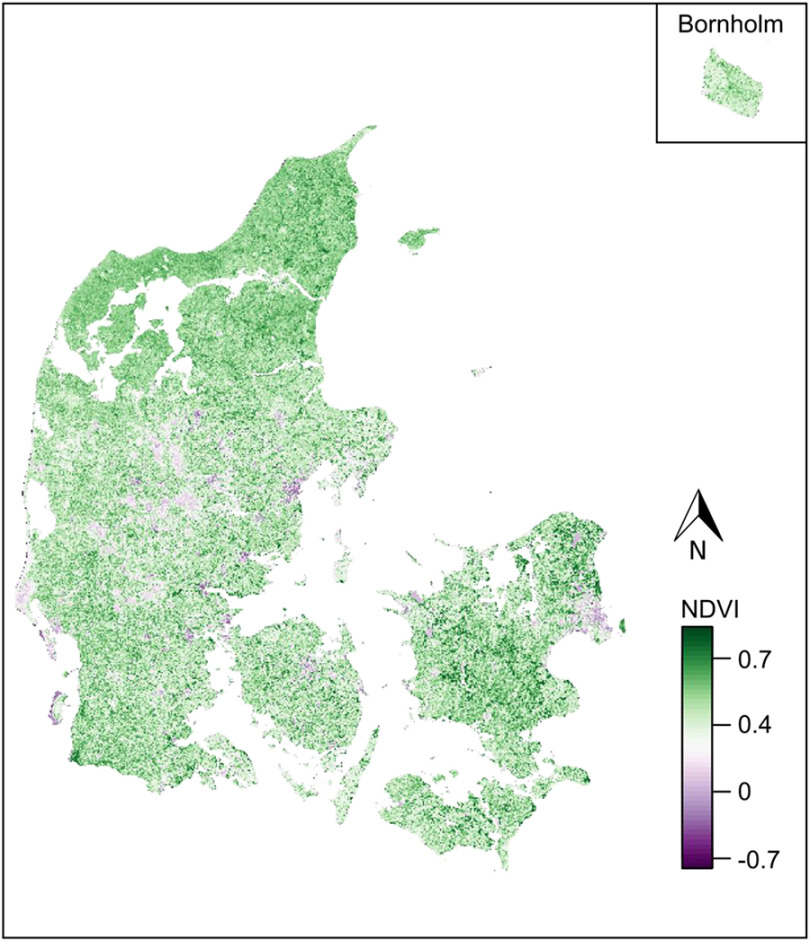
Figure 1 is a map of Denmark depicting calculated distribution of the normalized difference vegetation index from 1985 to 2013. High values of normalized difference vegetation index depict dense vegetation such as multilayered forests, and Low values of normalized difference vegetation index depicts areas with no or very little vegetation such as parking lots. A scale depicting normalized difference vegetation index ranges from negative 0.7 to 0 in increments of 0.7, 0 to 0.4 in increments of 0.4, and 0.4 to 0.7 in increments of 0.3.

Map of Denmark showing the distribution of the normalized difference vegetation index (NDVI). NDVI was calculated as the yearly mean for the period 1985–2013. High values of NDVI is indicative of dense vegetation such as multilayered forests, whereas low values of NDVI indicate areas with no or very little vegetation such as parking lots.