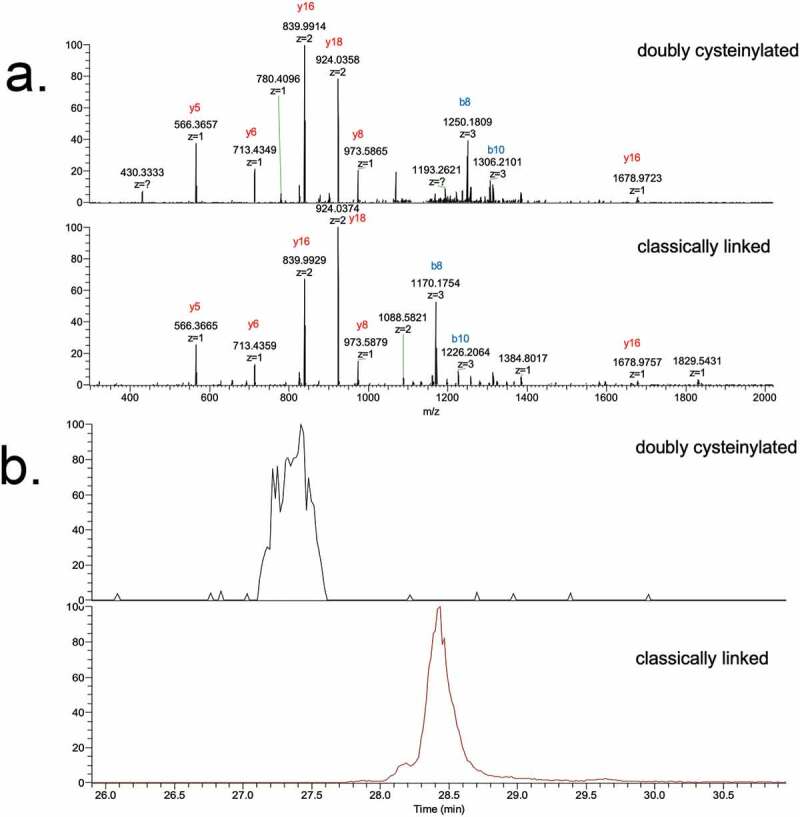
Figure 7.

PRM experiments of endogenous IgG2 Lys-C peptide maps. (a) PRM spectra using CID fragmentation and Orbitrap detection (30 000 resolution, 10 ppm mass tolerance for assignments). (b) Corresponding extracted ion chromatograms of precursor/b8 product ion transitions (10 ppm mass tolerance for extraction). Depicted here is data of endogenous IgG2s affinity purified from a single human subject, as an example (in total 10 human subject samples were analyzed)
