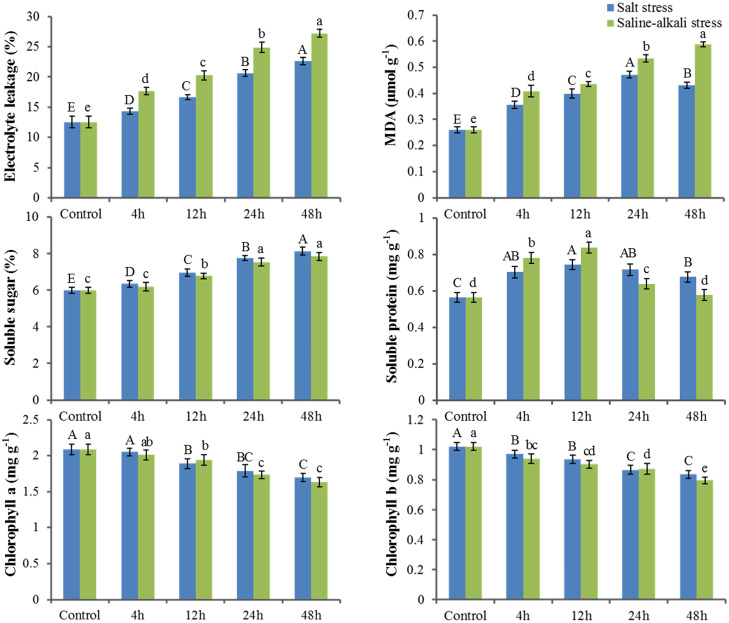
Fig 1. Changes in electrolyte leakage (EL), malondialdehyde (MDA), sugar, protein, and chlorophyll a/b in leaf tissues of X. sorbifolia under salt and saline-alkali stress.
4–48 h indicate different times of exposure to these two stresses. Error bars represent means ± SD (n = 3), and letters indicate significant statistical difference at p<0.05.

