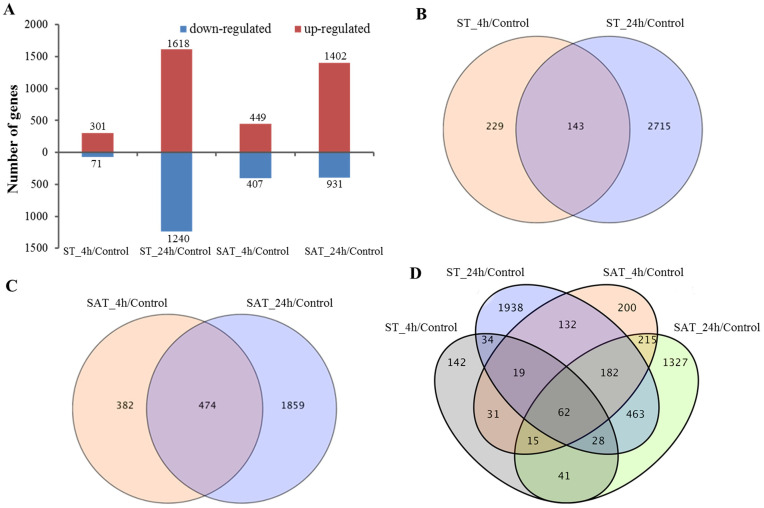
Fig 3. DEGs in the four pairwise comparisons of the control and stress treatments.
(A) Bar chart showing the number of up- and downregulated genes in different comparisons. Venn diagram exposed the overlap of DEGs in two pairwise comparisons of salt stress (B), two pairwise comparisons of saline-alkali stress (C), and all four pairwise comparisons (D), respectively.

