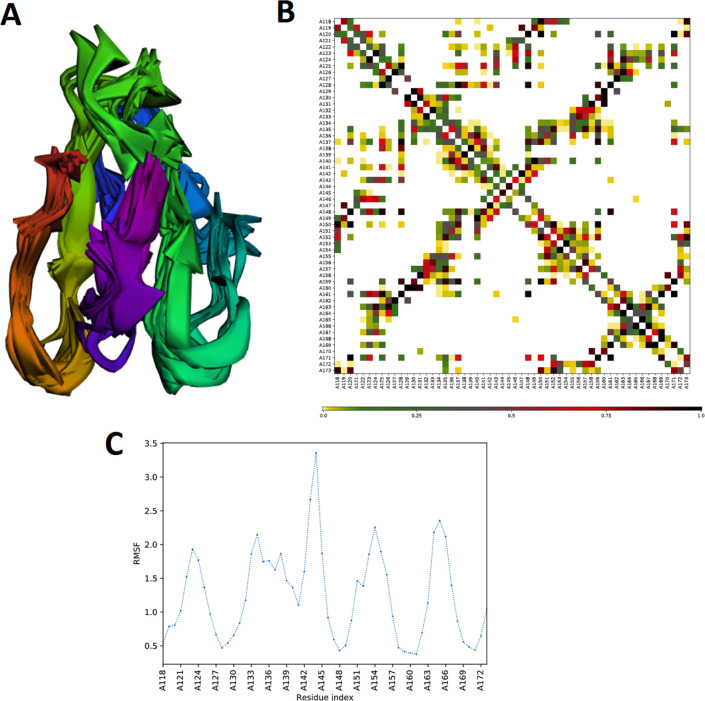
Fig 5. MEV structural flexibility results.
(A) Cartoon representation of top 10 final models showing obvious fluctuation throughout. (B) MEV residue-residue interaction/contact map. The interactive area is represented in the central panel. (C) RMSF plot representing the obvious fluctuations of MEV residues during simulation.

