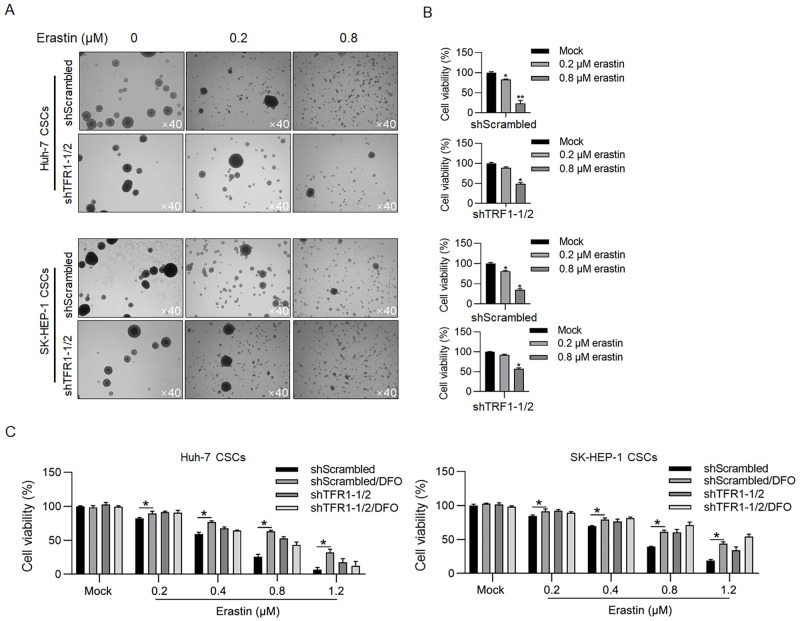
Fig 5. TFR1 promoted erastin-induced death in CSCs.
A. After TFR1 knockdown, sphere formation under the presence of 0.2 or 0.8 μM erastin was observed. Images were obtained using a 40× objective. B. After TFR1 knockdown, cell viability was measured in the presence of 0.2 or 0.8 μM erastin by performing the CCK-8 assay. *P<0.05, vs. the Mock group; **P<0.01, vs. the Mock group. C. Cell viability was measured in the presence of DFO, a ferroptosis inhibitor. *P<0.05, vs. the shScrambled group.

