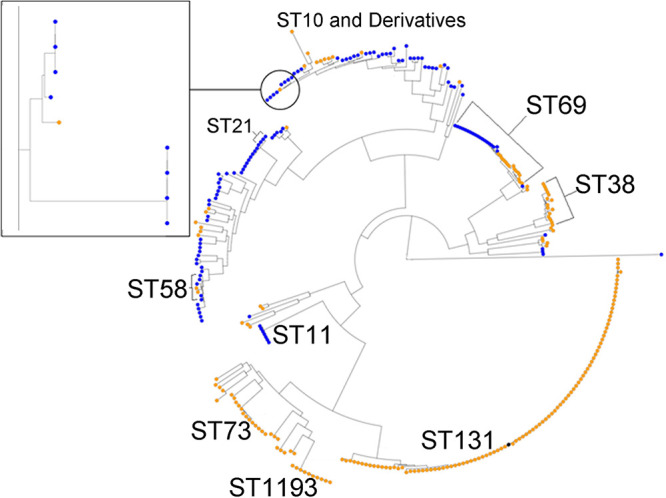
FIG 3.

Phylogenetic analysis of E. coli from dairy farms and human UTI collected in parallel in a 50- by 50-km region. Human isolates are in orange; cattle isolates are in blue. The reference ST131 isolate is in black. Certain key STs are highlighted, particularly STs with representatives from human and cattle isolates: ST21 (ST540), ST69, ST58, and ST10. The inset shows a more detailed analysis of ST10 isolates, which represents the closest relationship between a human and a cattle isolate: 205 SNPs different across the core genome.
