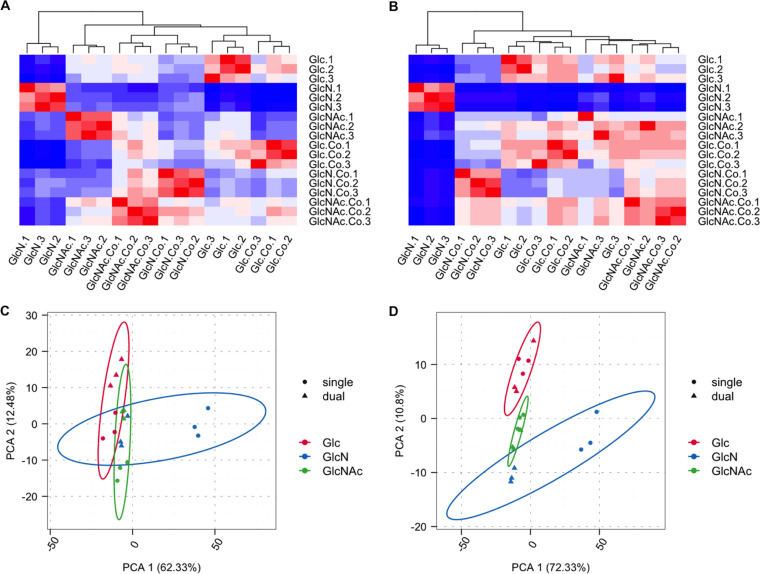
FIG 1.
Clustering (A and B) and principal-component analysis (C and D) of 18 RNA-Seq samples for S. mutans (A and C) and S. gordonii (B and D). (A and B) Heatmap of the cluster analysis shows the Euclidean distances between the samples, as calculated from the variance-stabilizing transformation of the count data. (C and D) The circles in PCA diagrams represent single-species samples, and the triangles represent mixed-species samples. The red, blue, and green symbols represent samples grown on glucose (Glc), GlcN, and GlcNAc, respectively.

