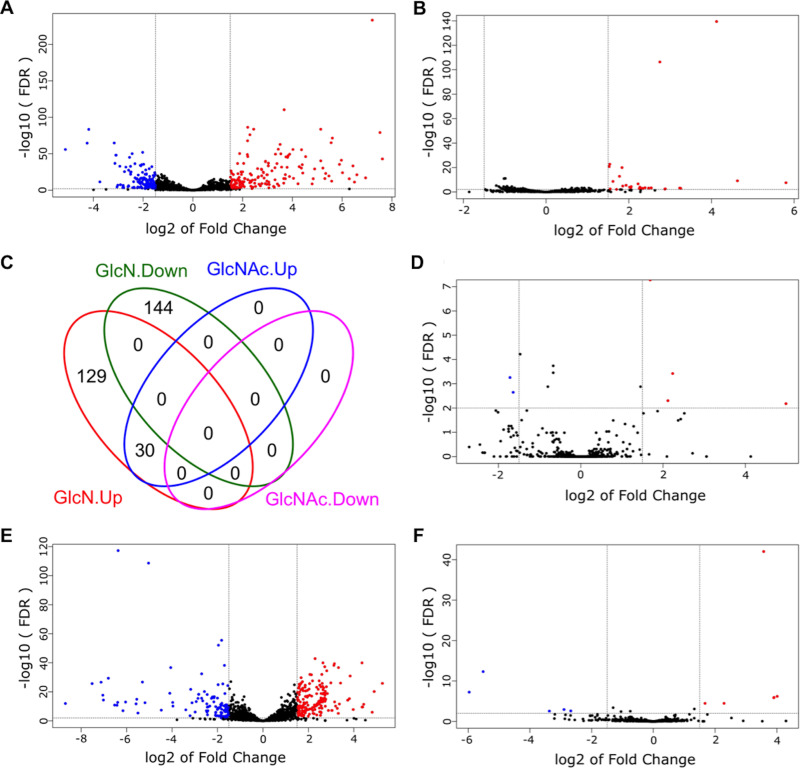
FIG 3.
DEG from S. gordonii DL1 identified by RNA-Seq. The DEG were identified by comparison of single-species cultures between GlcN and Glc (A) or GlcNAc and Glc (B) and by comparison of mixed-species cultures against single-species cultures, each grown on Glc (D), GlcN (E), or GlcNAc (F). Red circles depict DEG with increased expression, and blue circles depict those with decreased expression. (C) All DEG from single-species cultures are presented as one Venn diagram.

