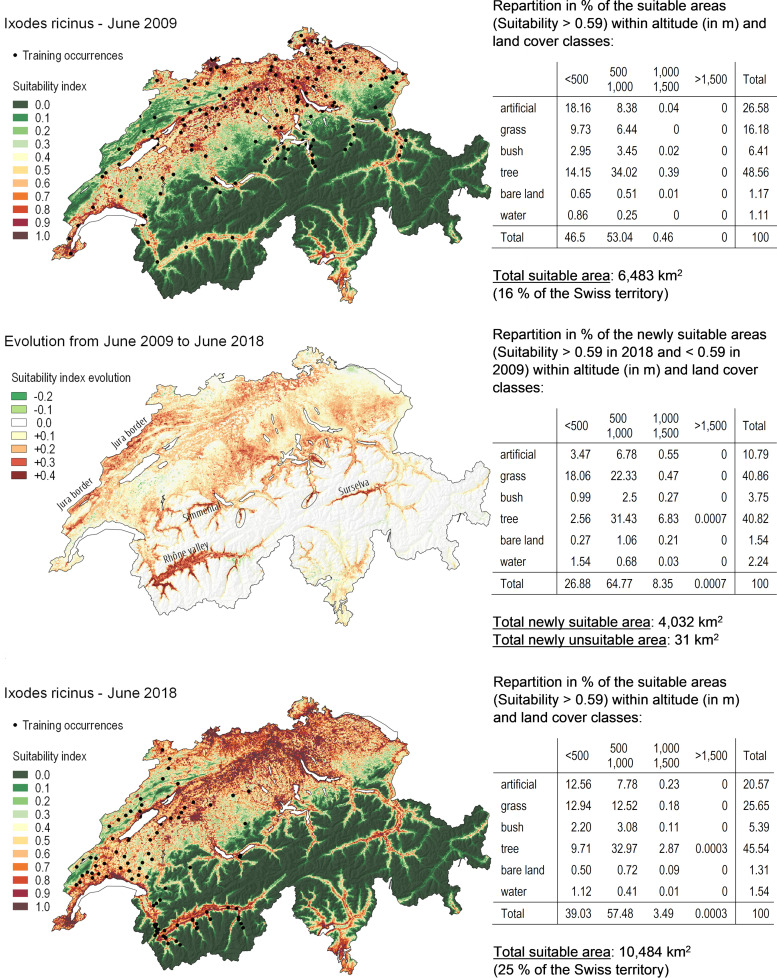
FIG 3.
Suitability maps for Ixodes ricinus. Suitability map for Ixodes ricinus in June 2009 (upper panel) and June 2018 (lower panel) as predicted by the best model (i.e., with environmental variables extracted with a 100-m radius buffer and for the 2 years preceding the sampling date). The areas affected by transitions in suitability are represented in the middle panel.

